Gies Sustainability Dashboard Reformation
Overview - Context & Challenge
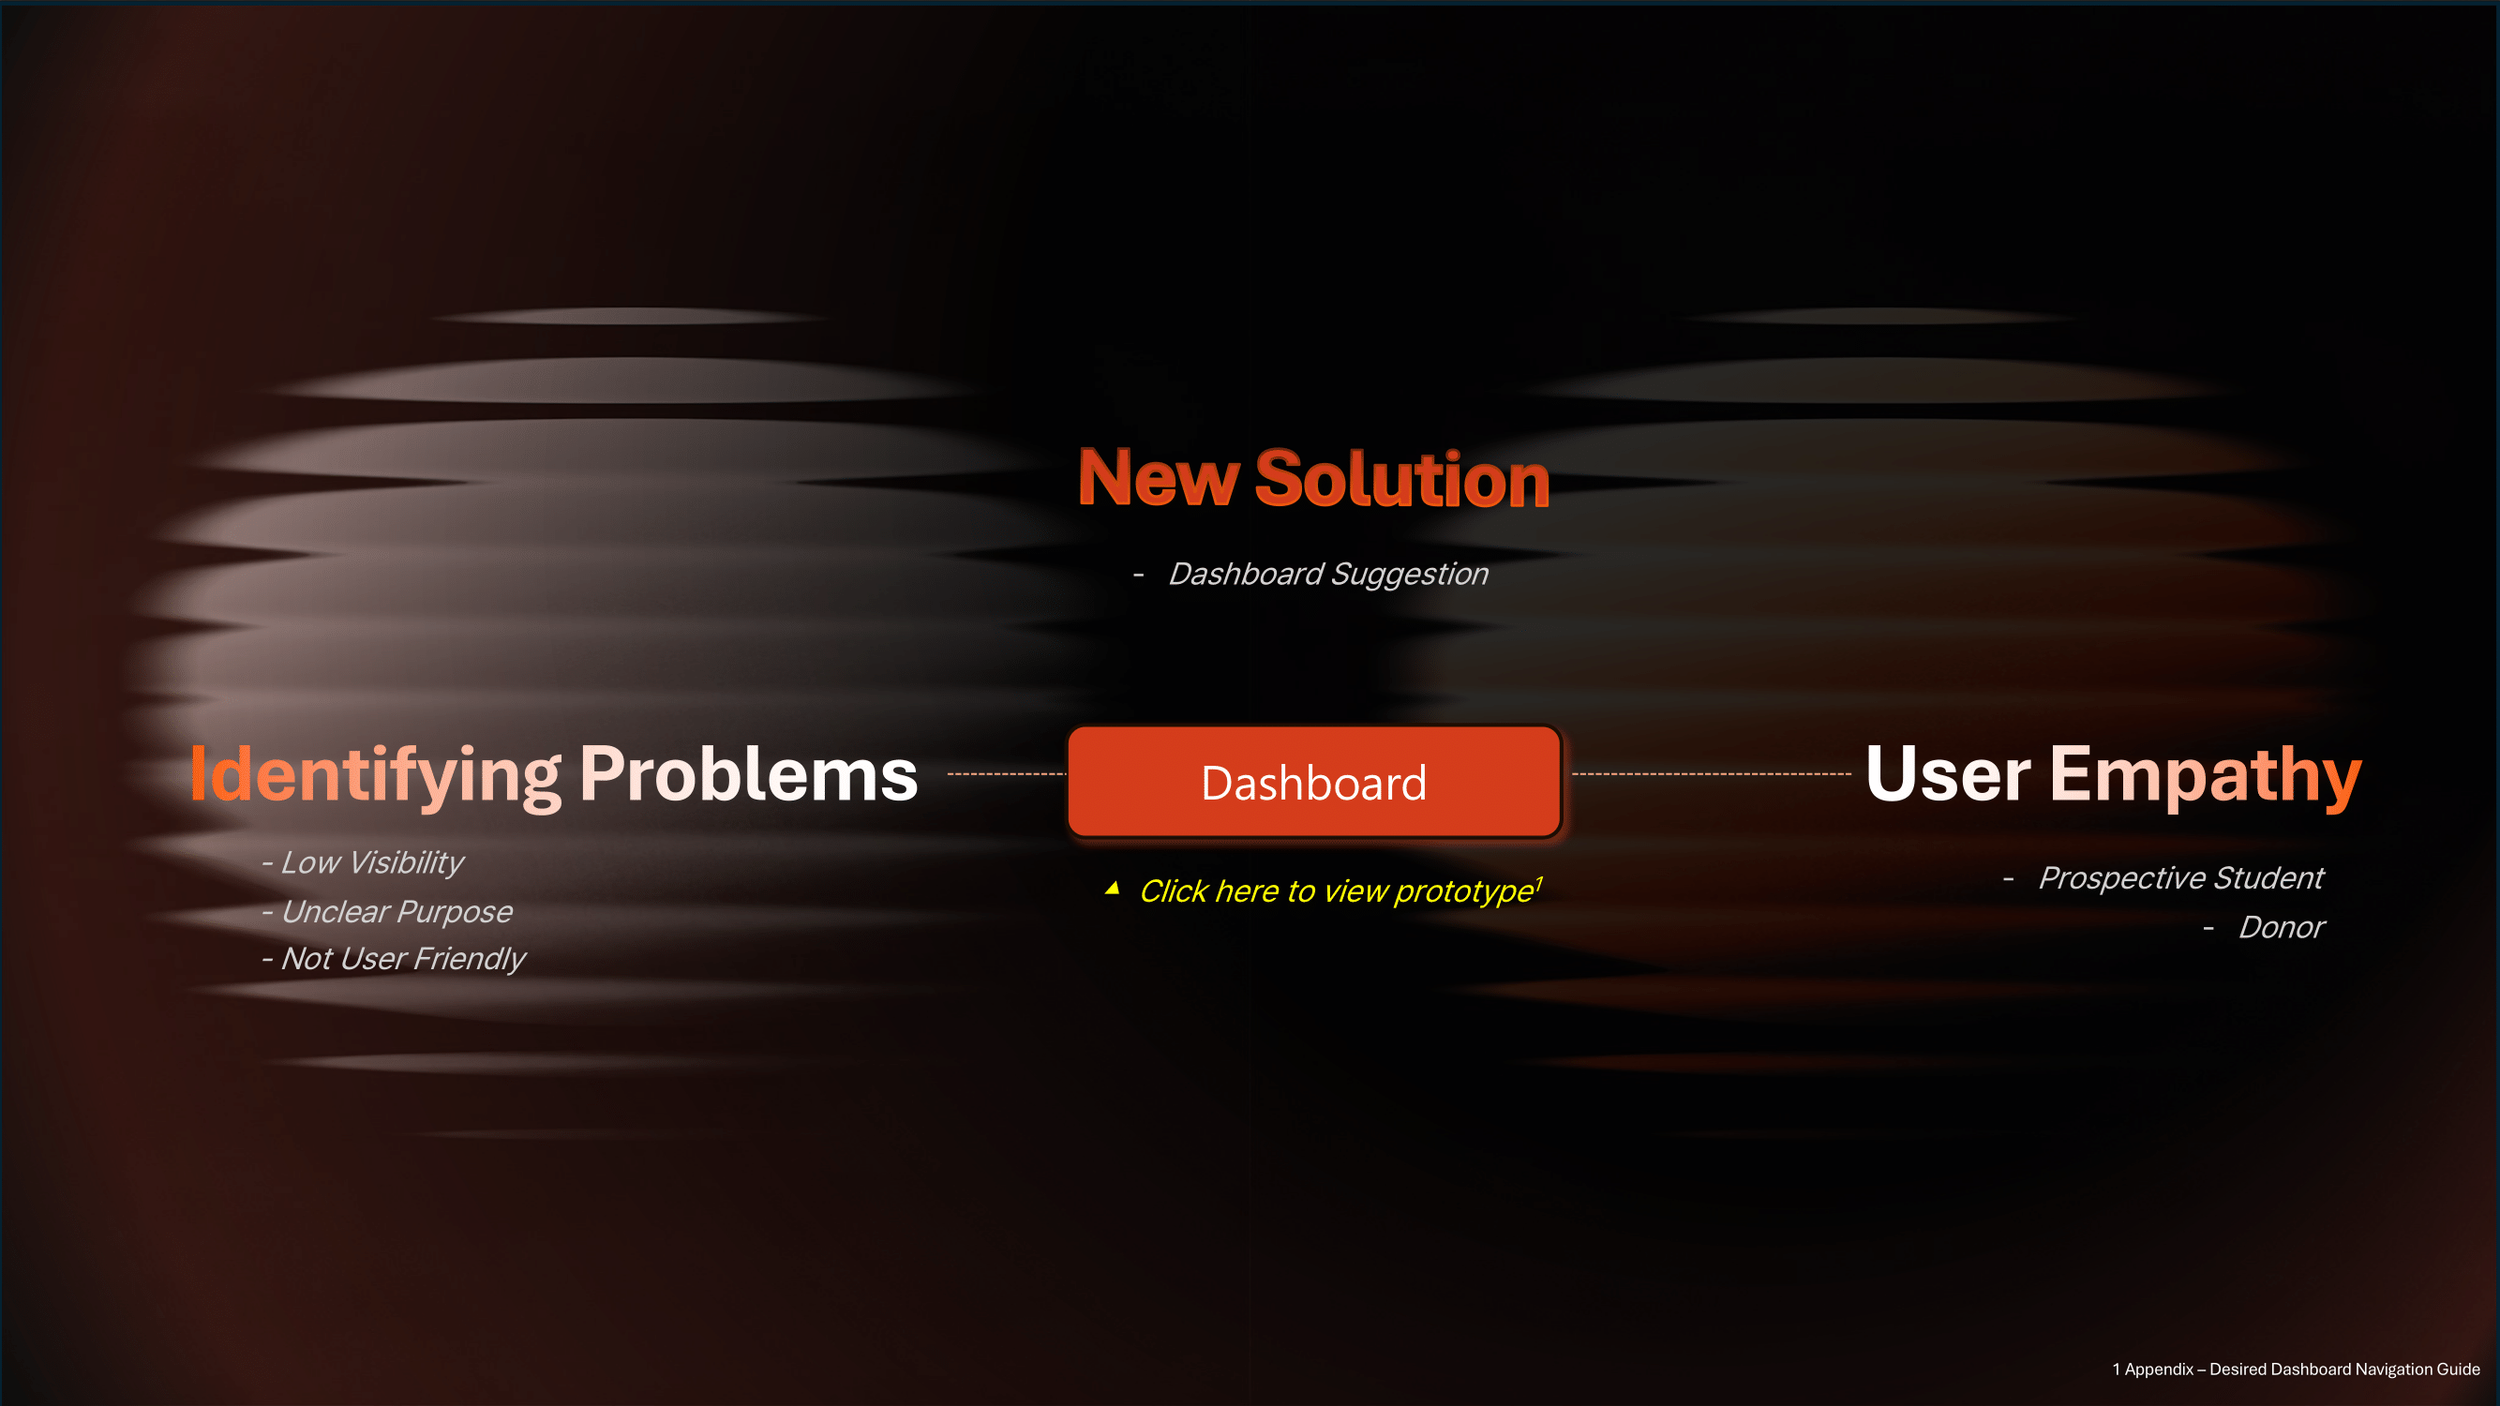
The competition challenged teams to improve the Gies Sustainability Dashboard by addressing three pillars:
• Scalable Data Strategy
• Insight Generation
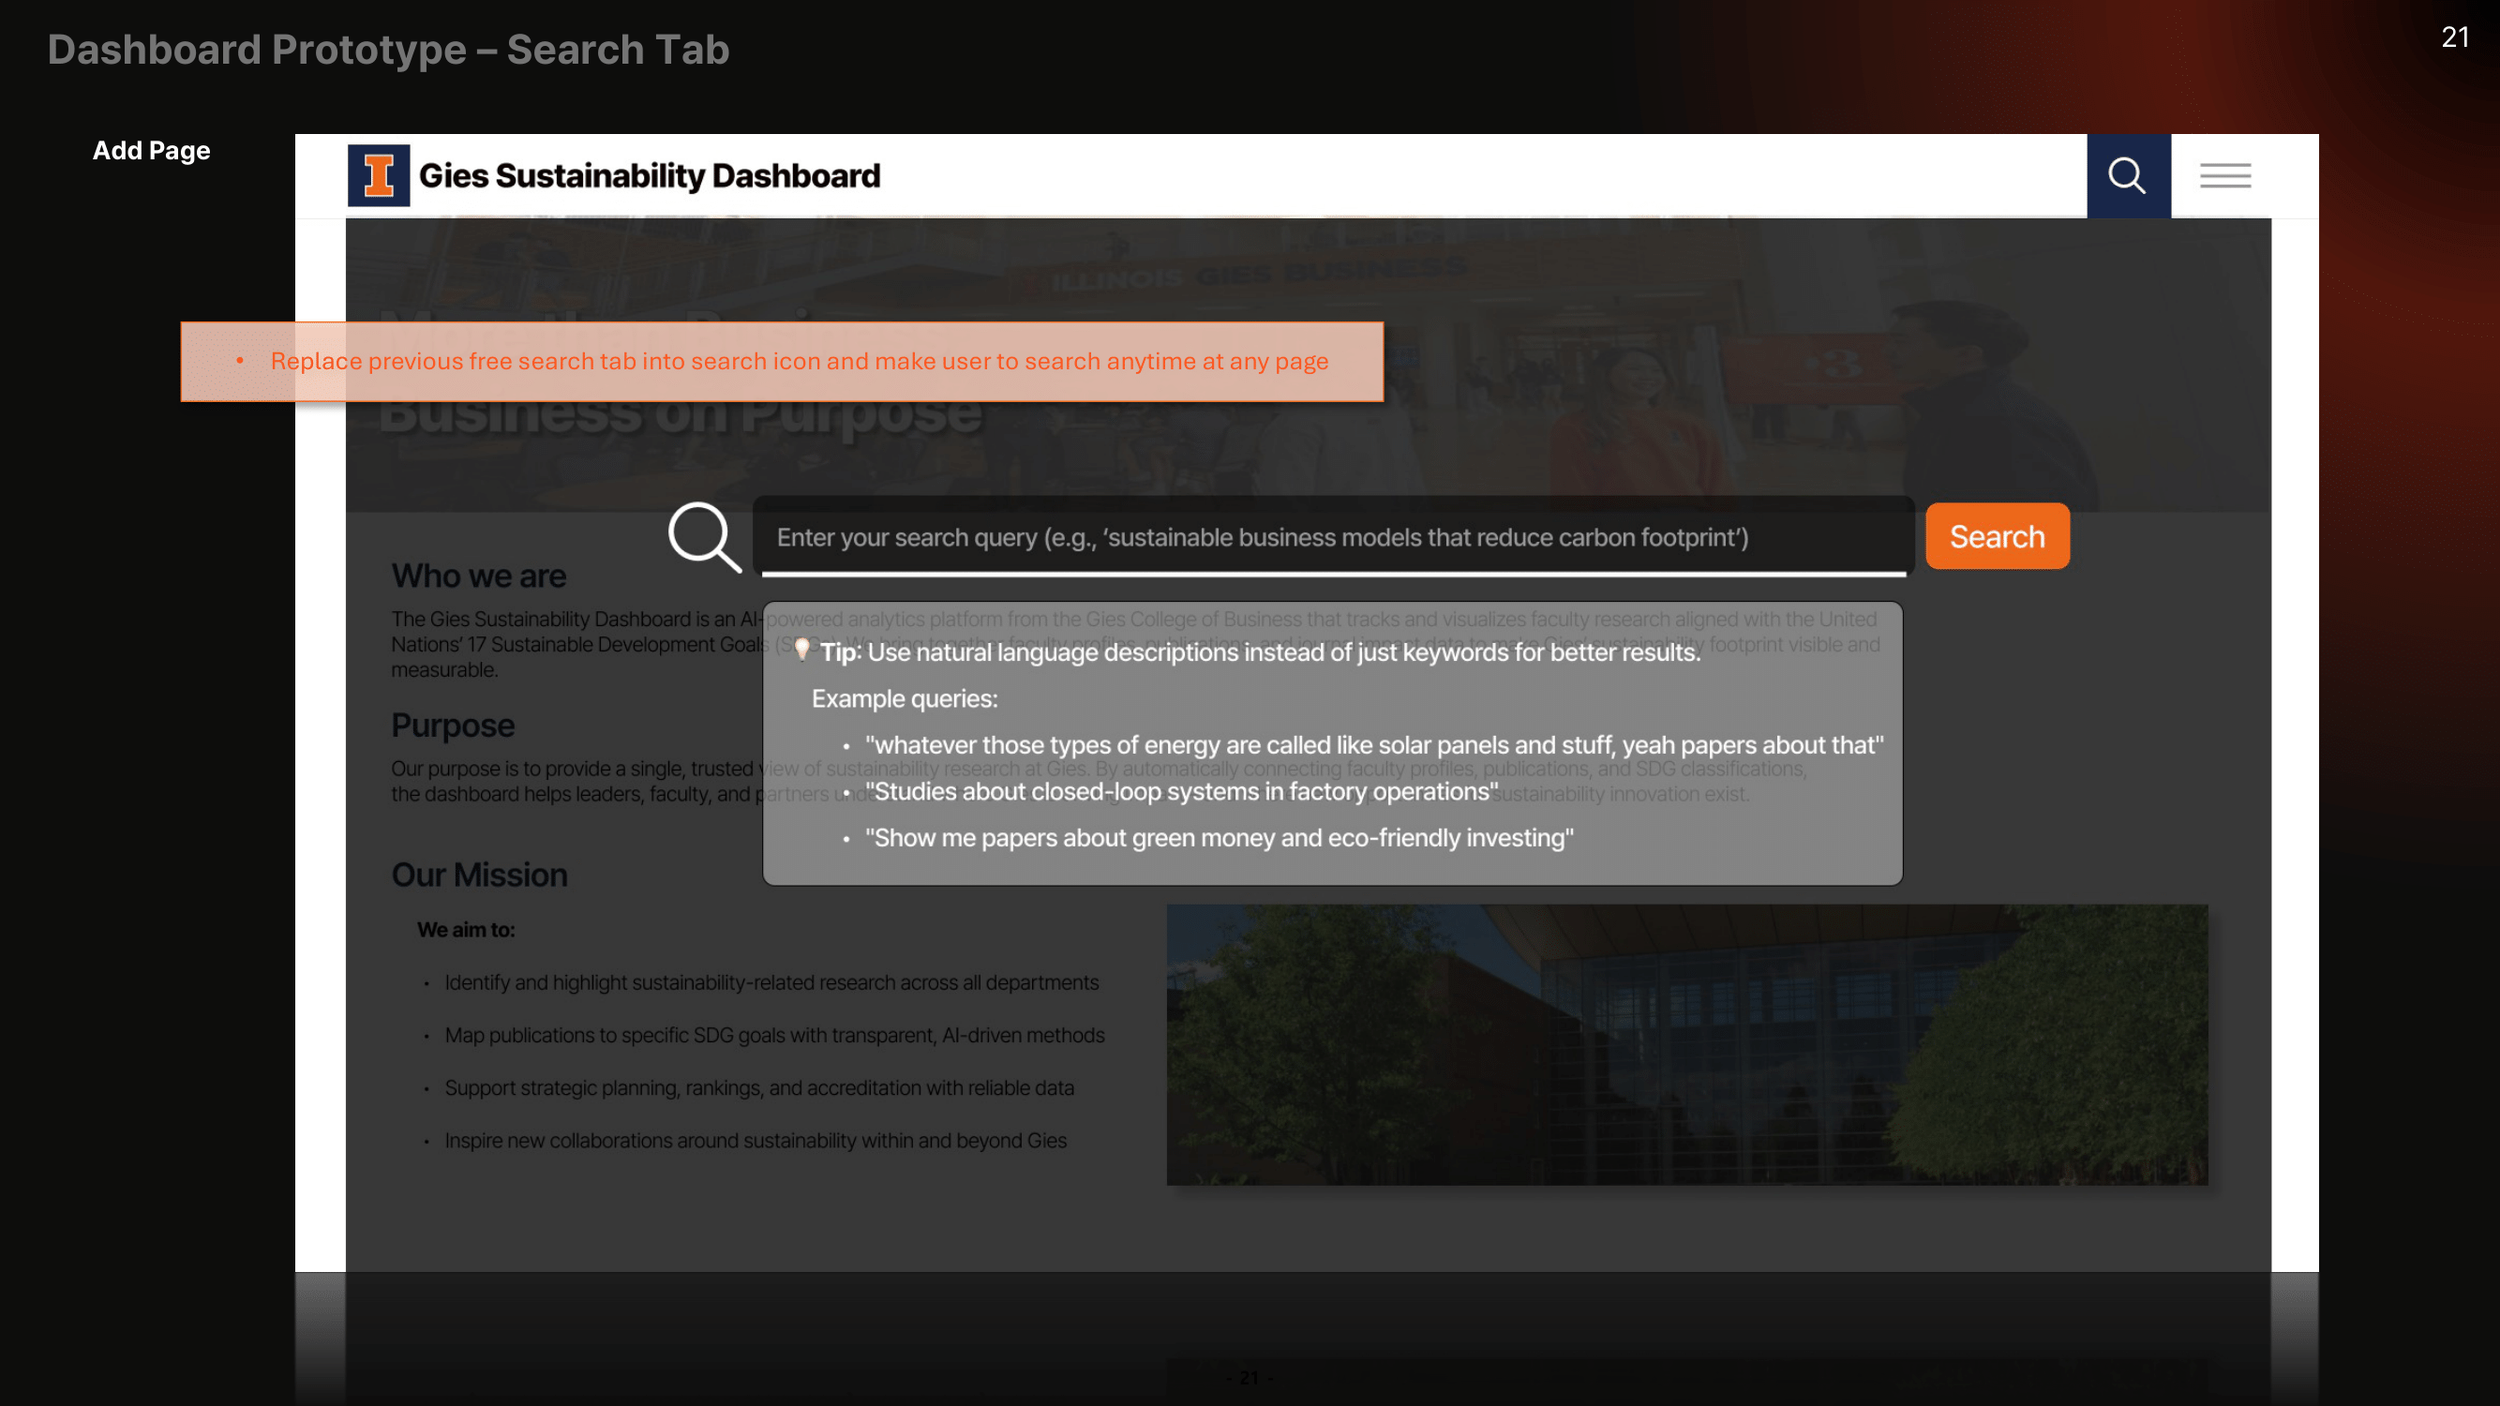
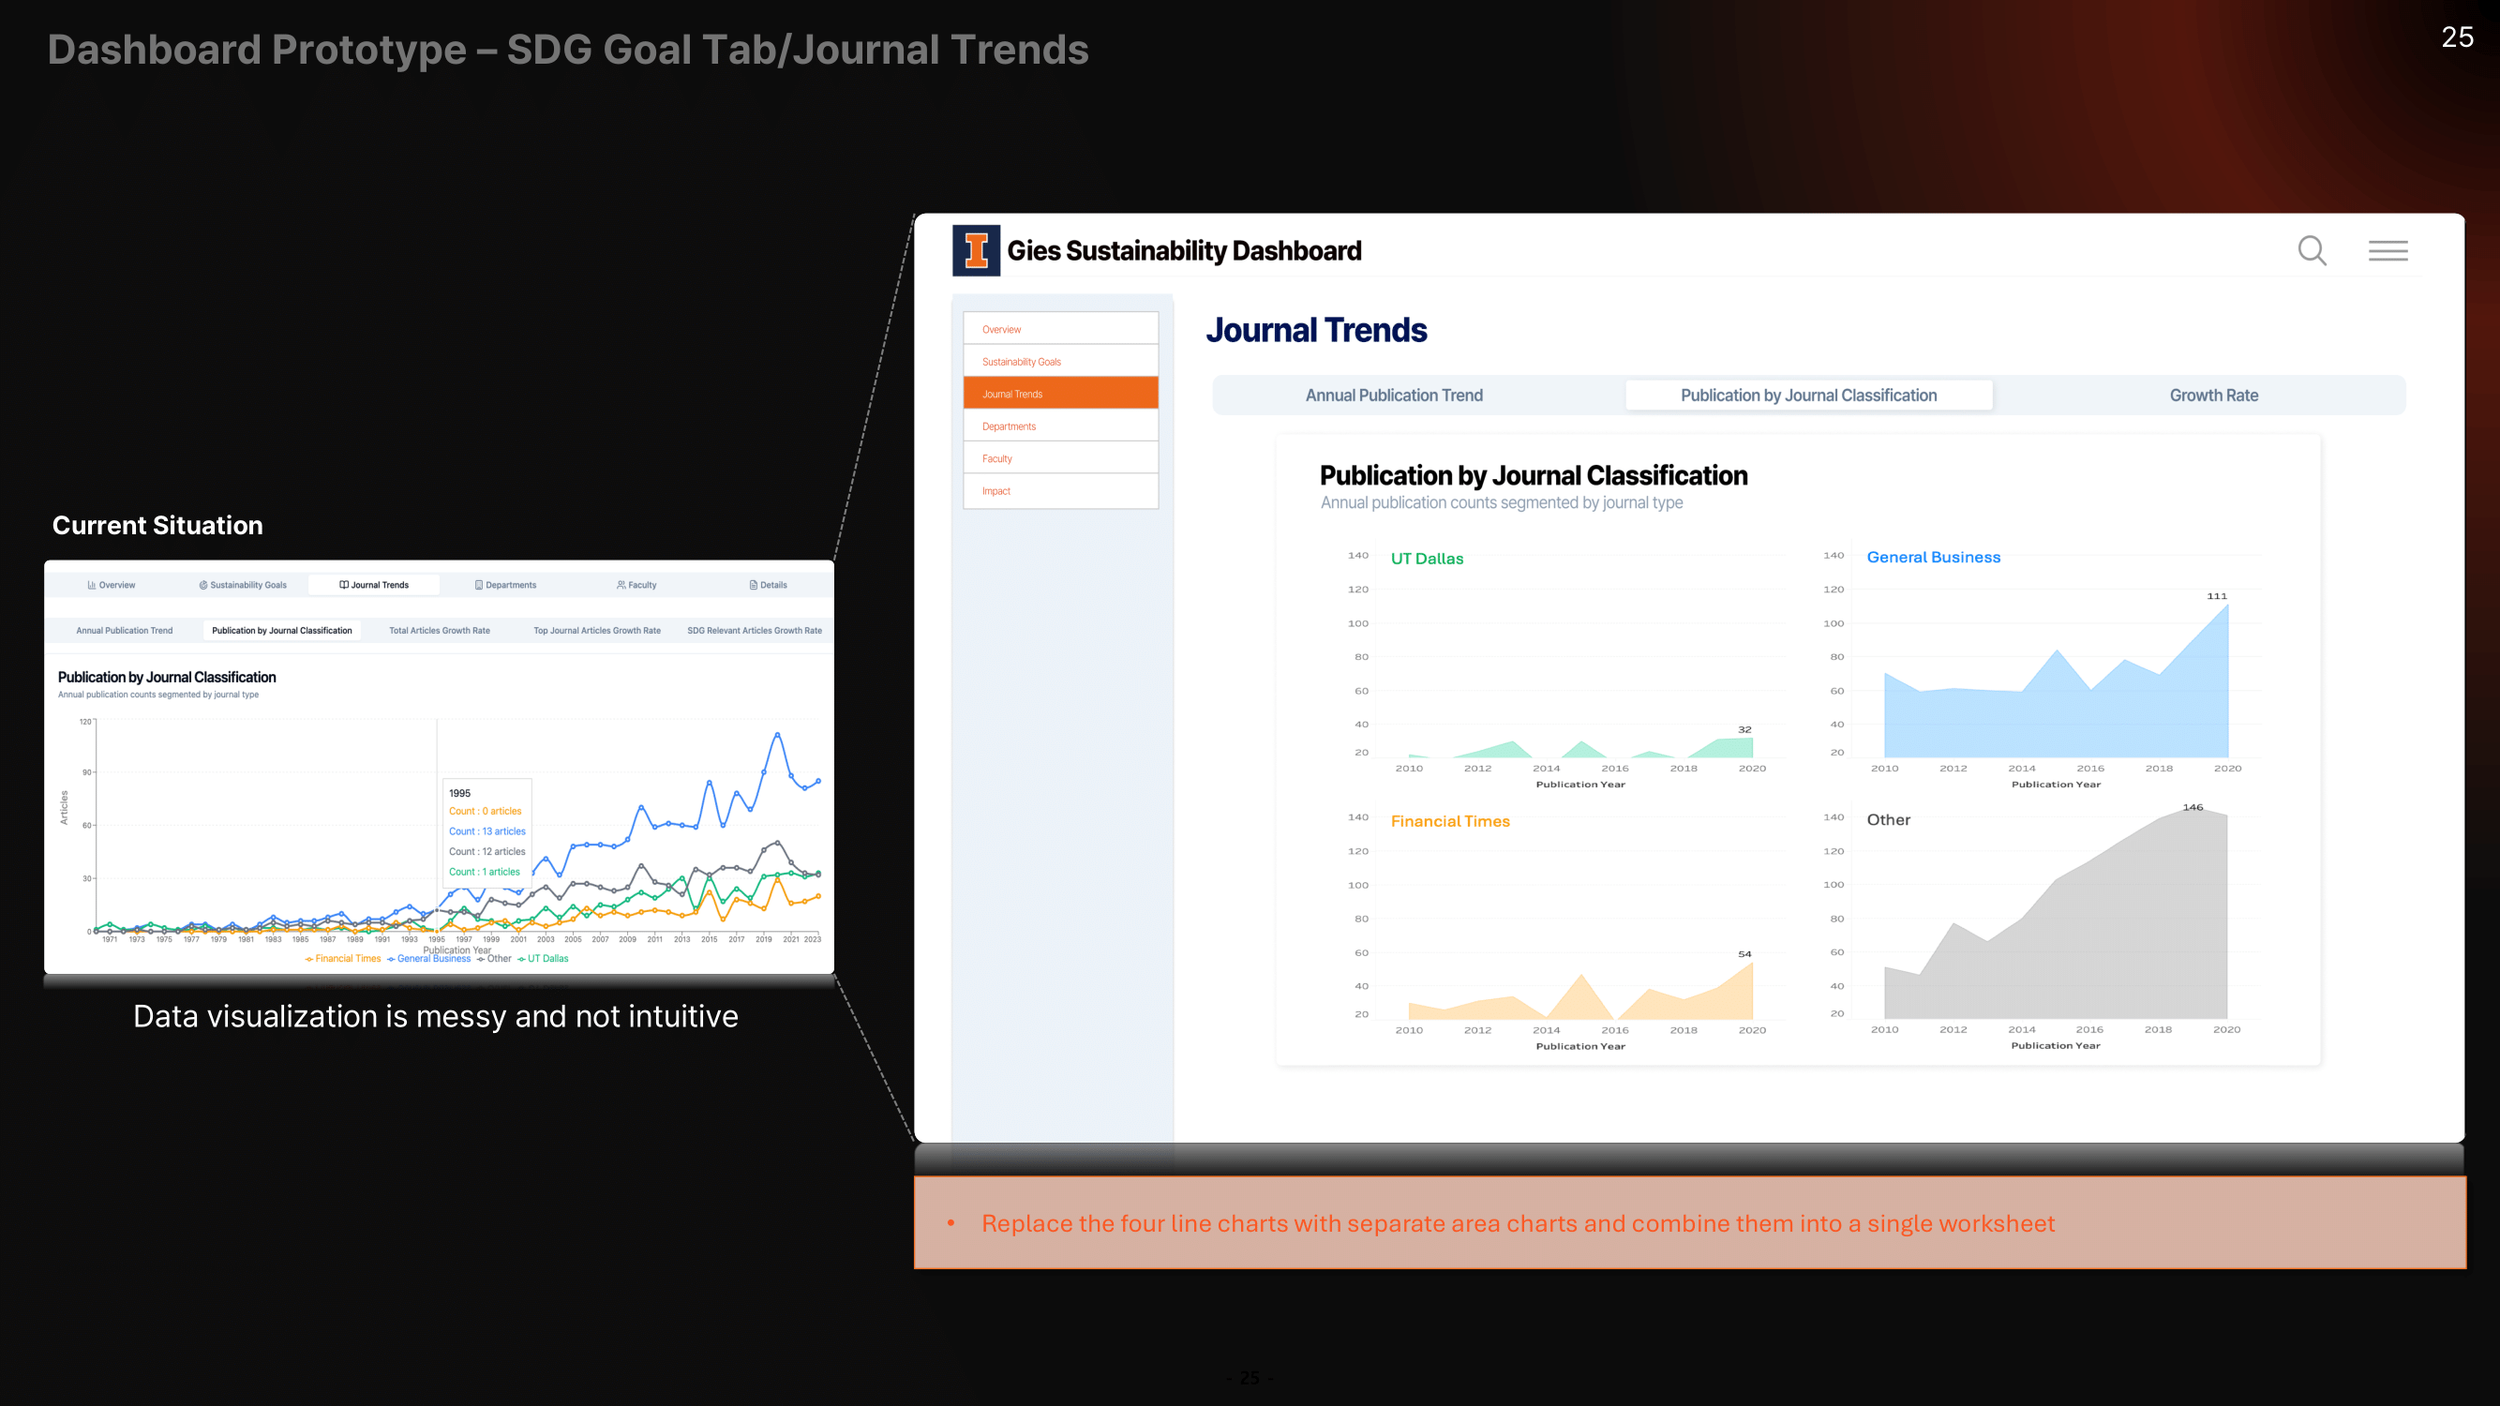
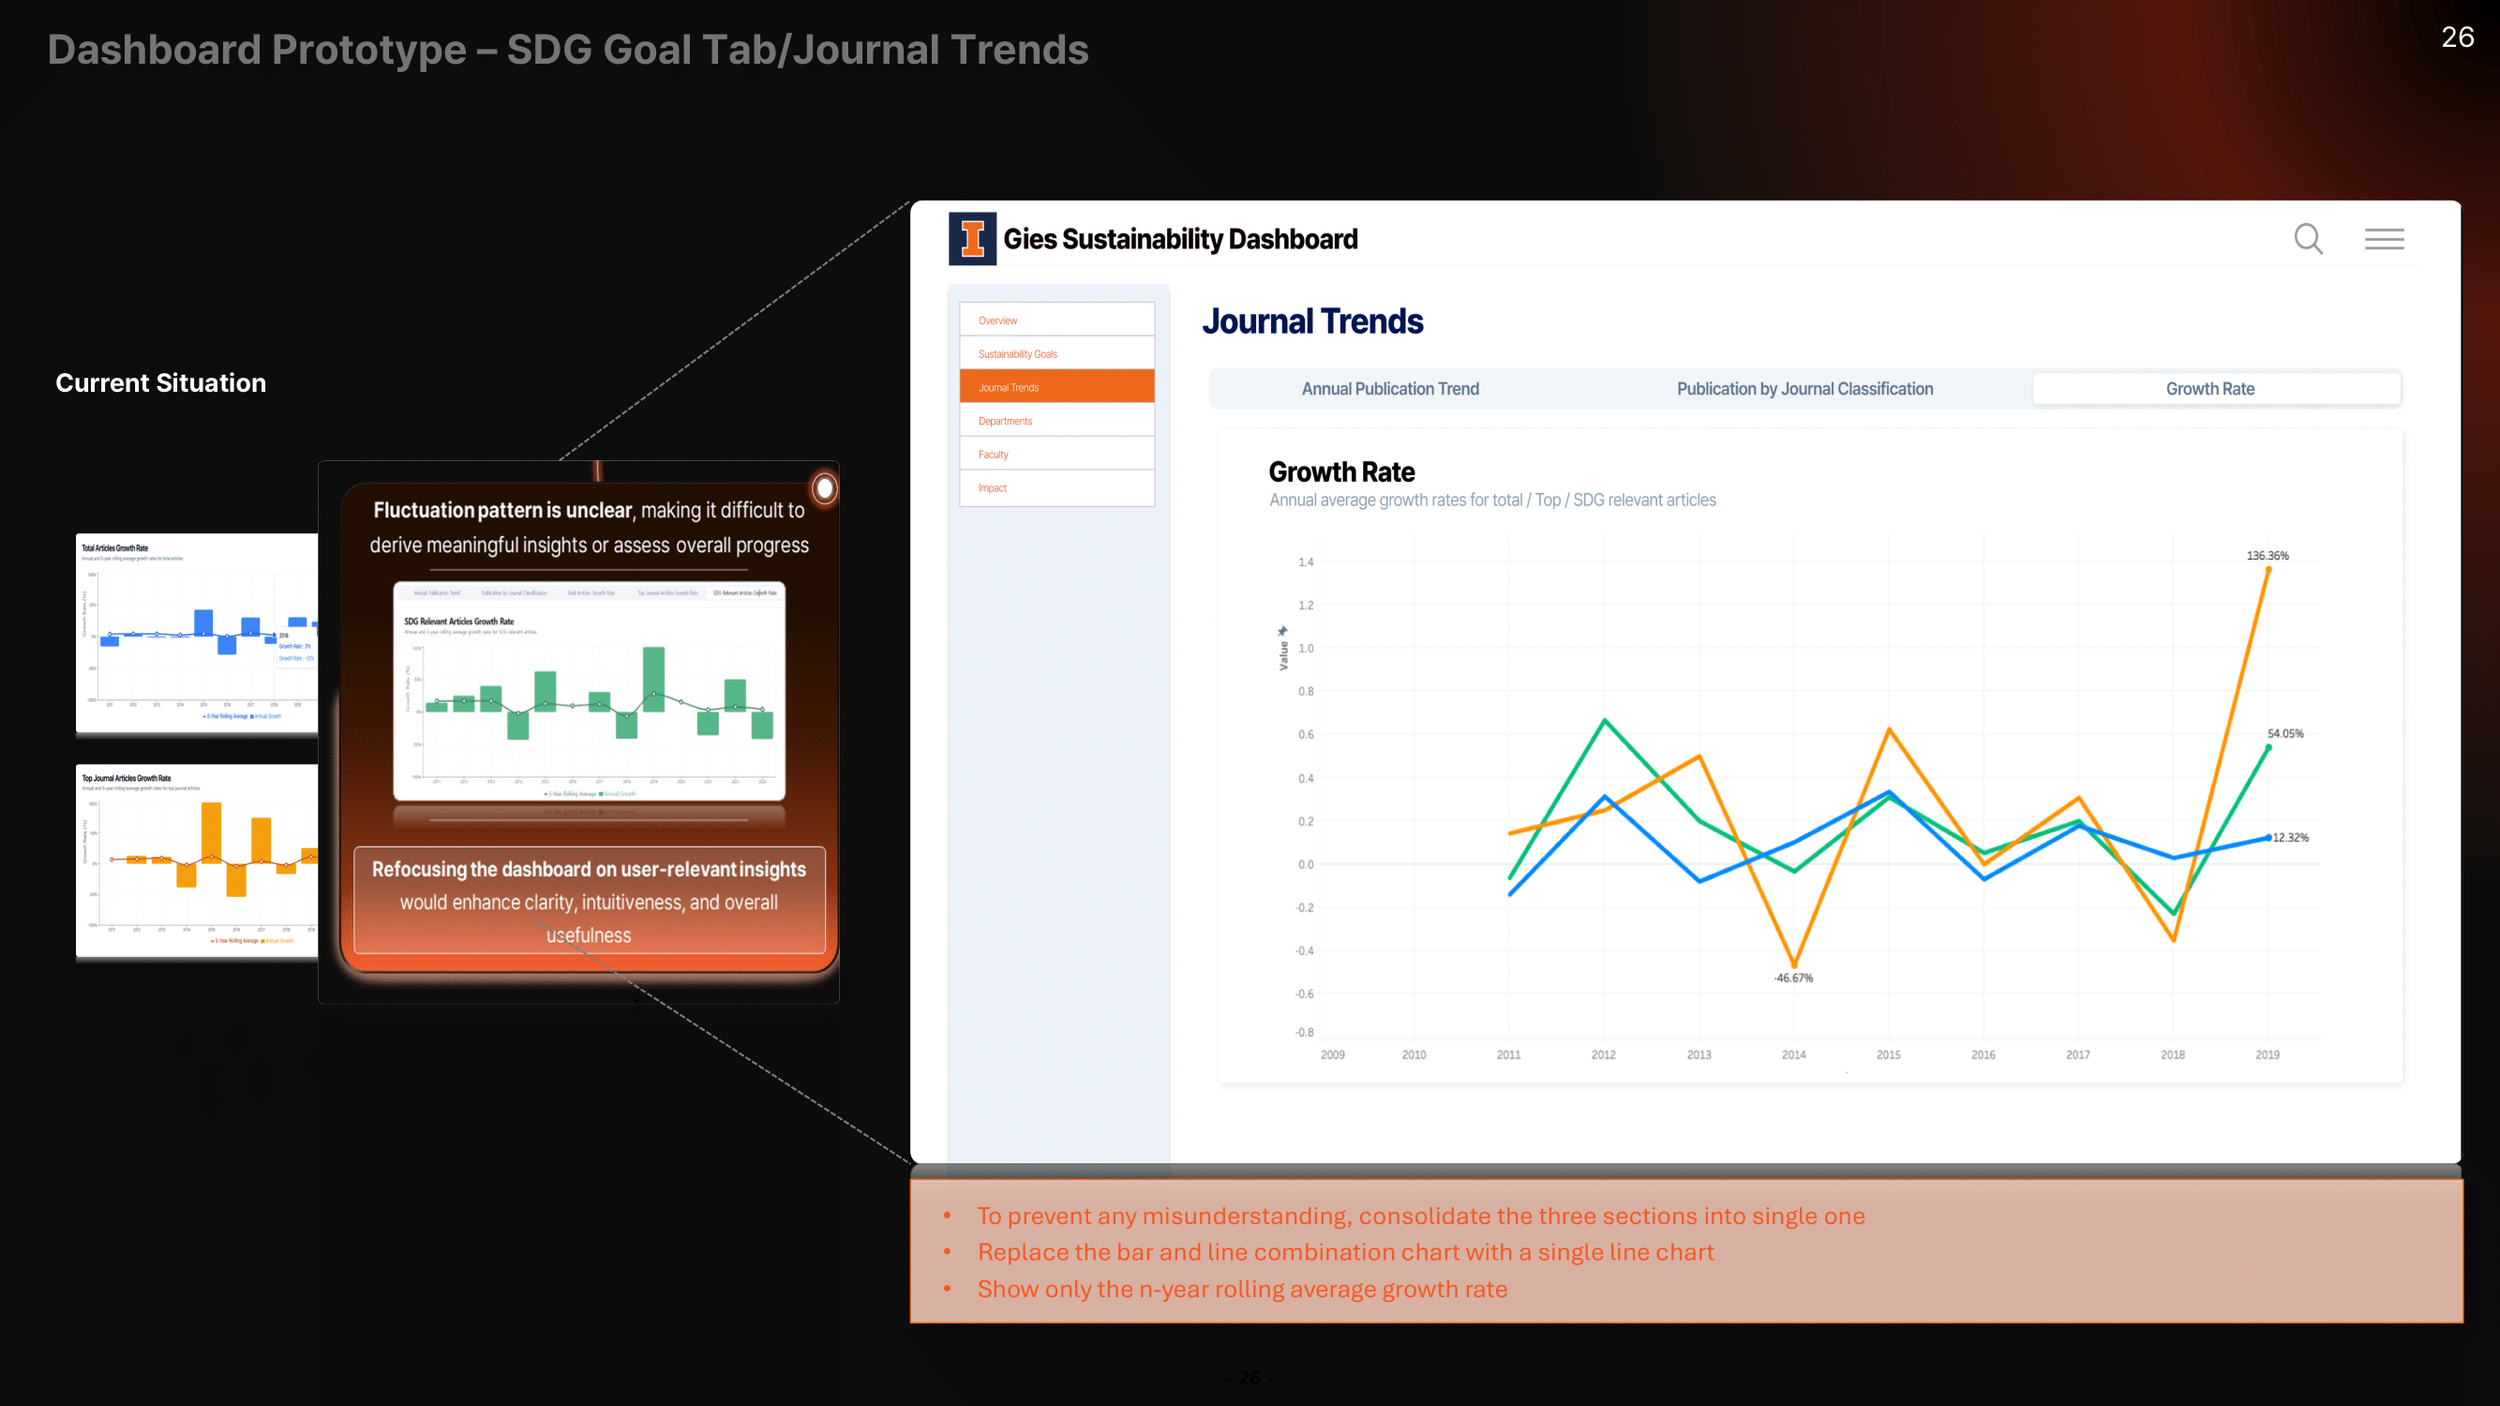
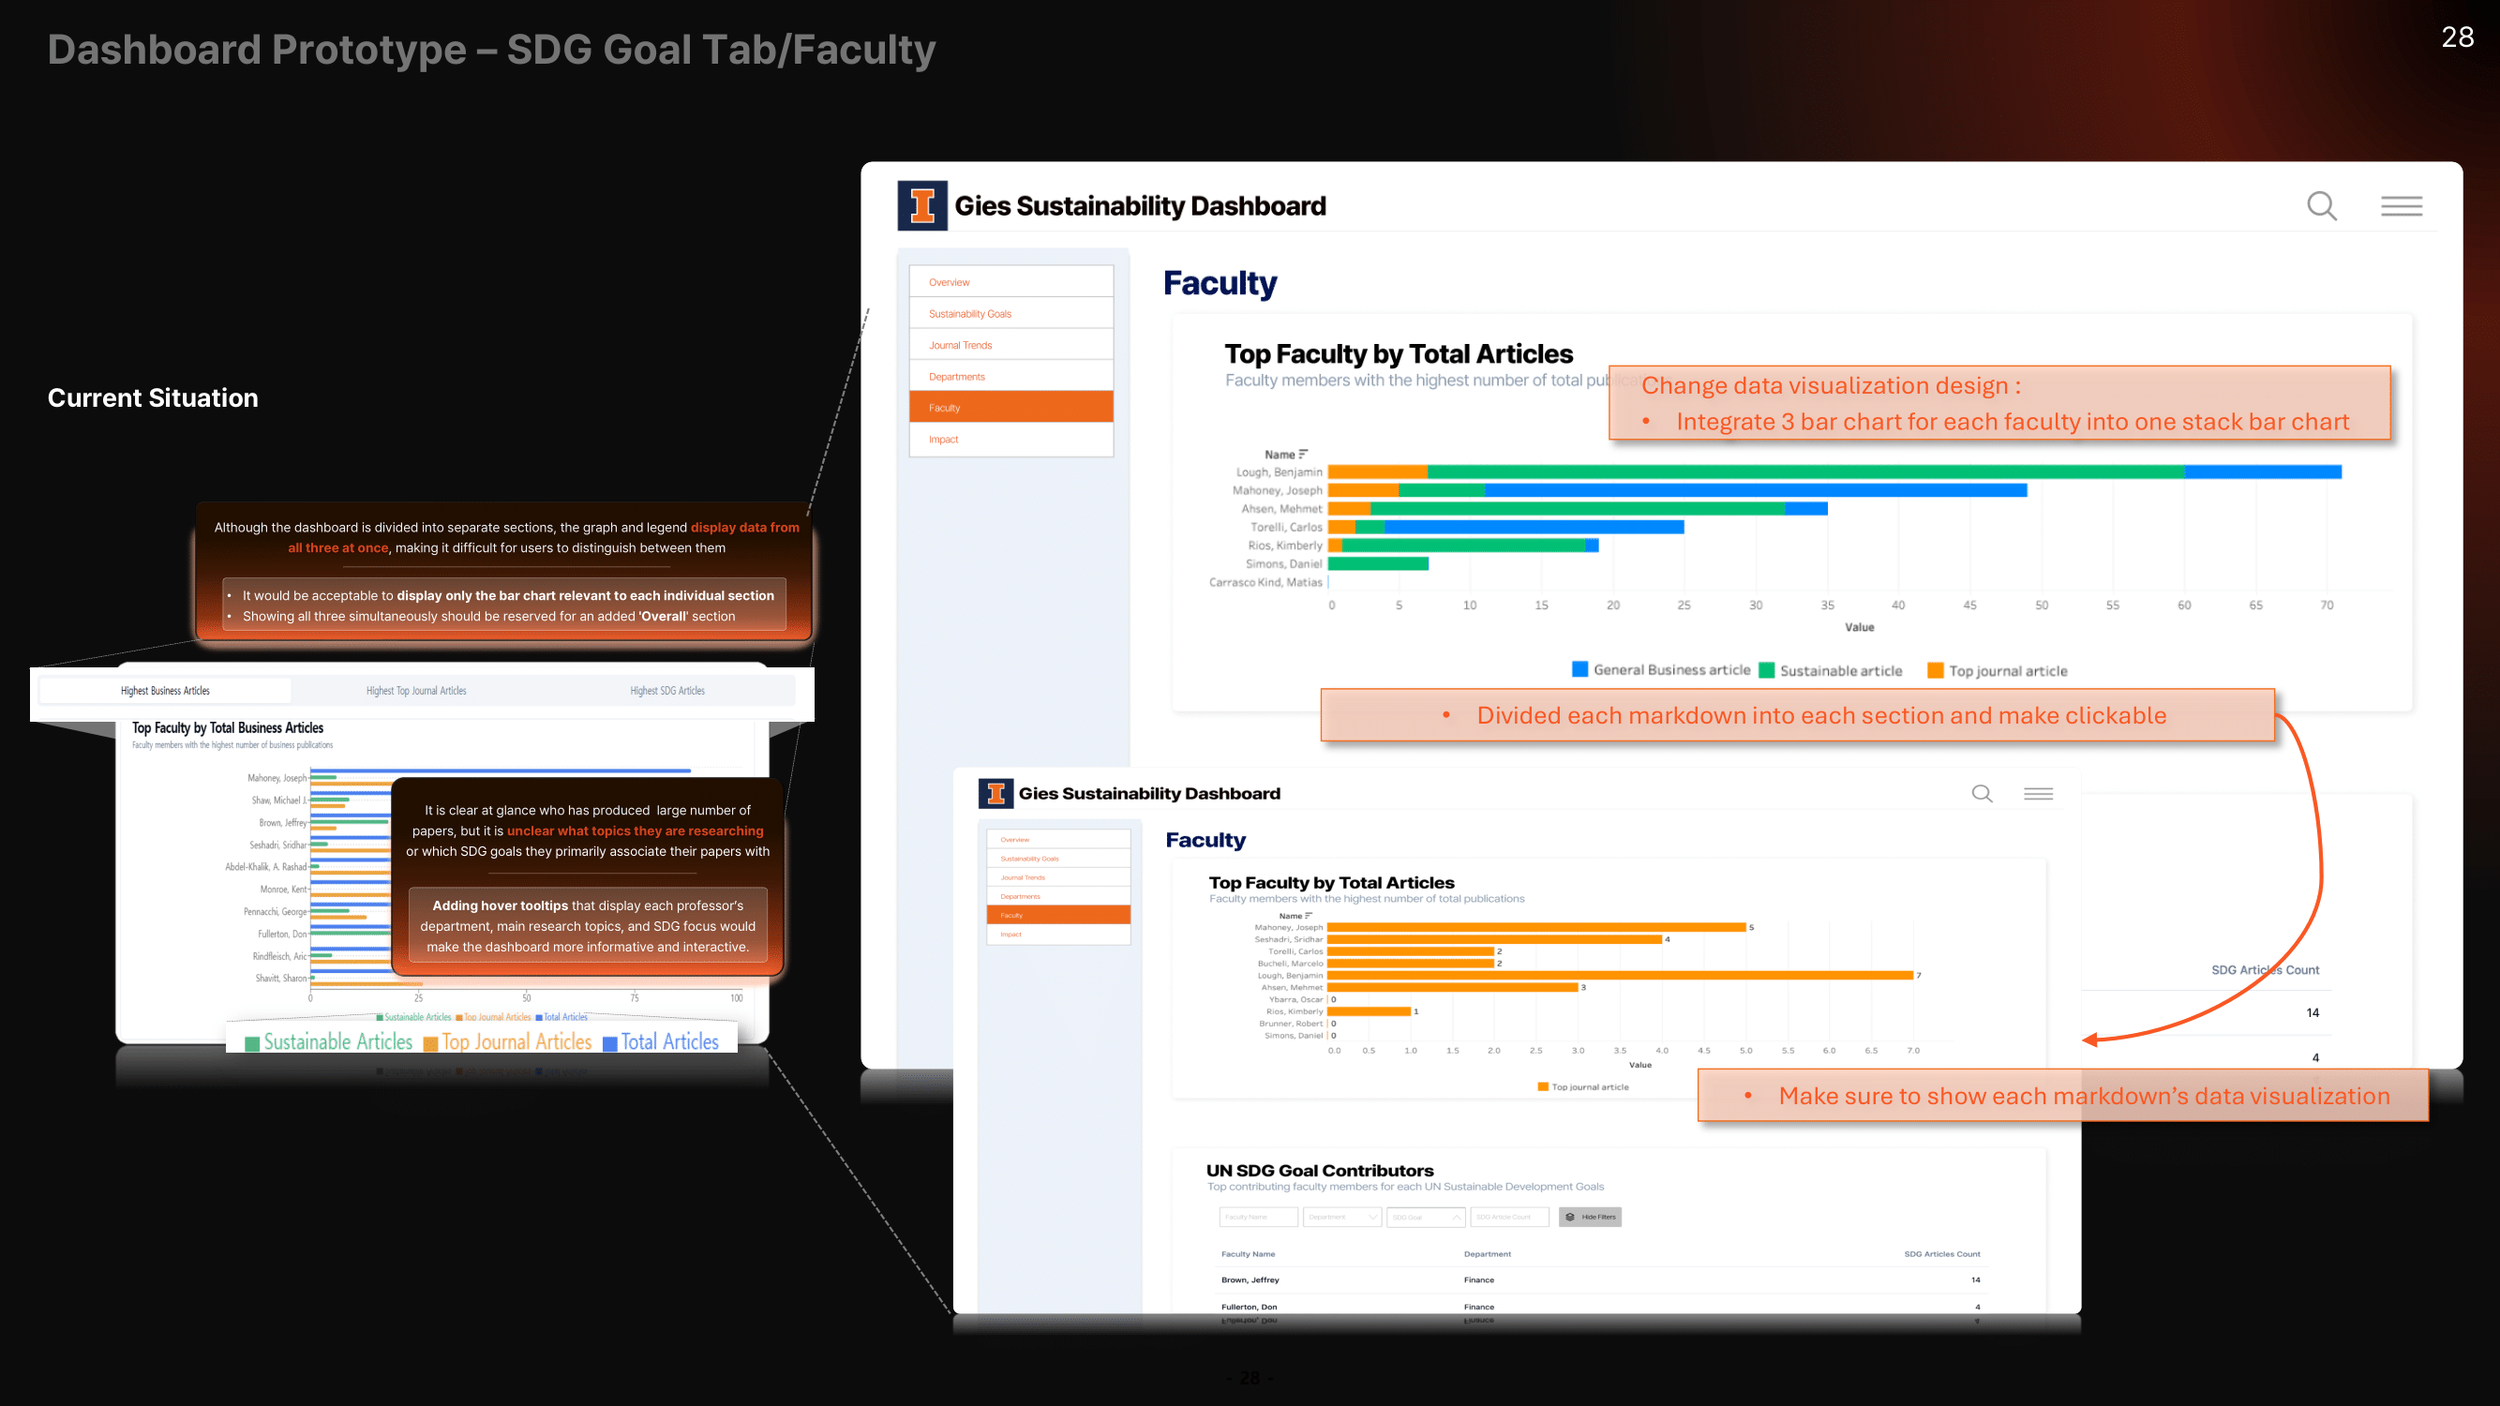
• Dashboard Visualization
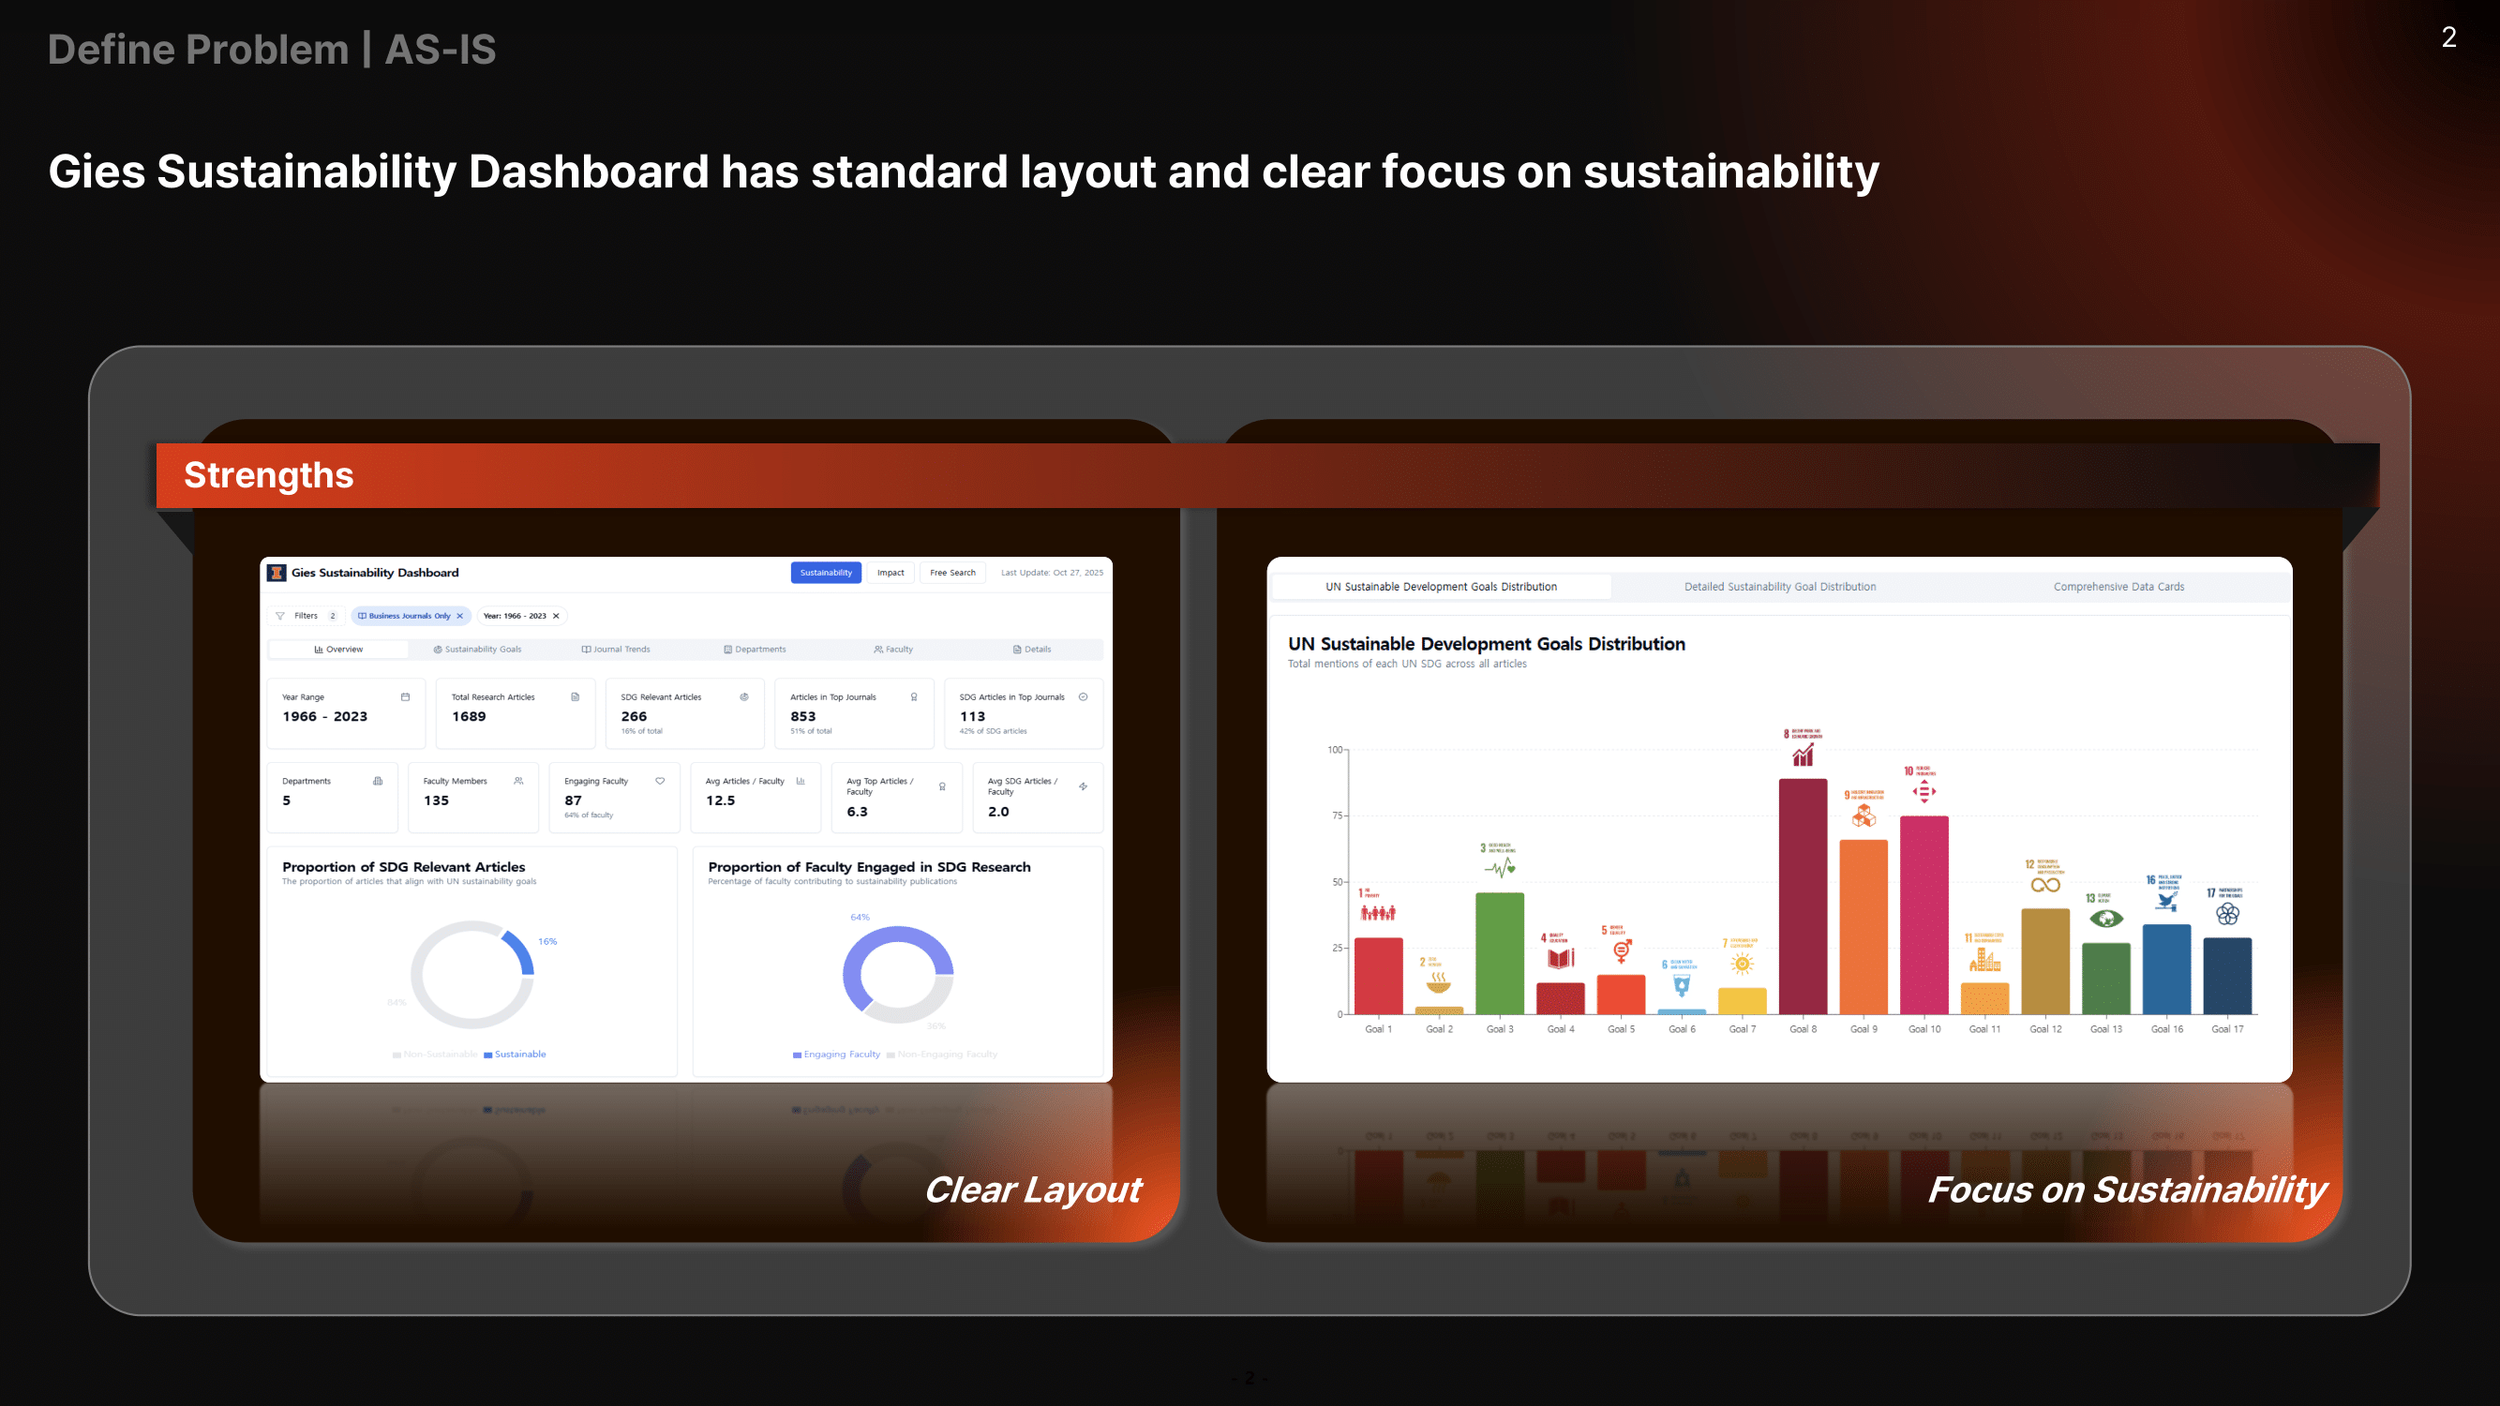
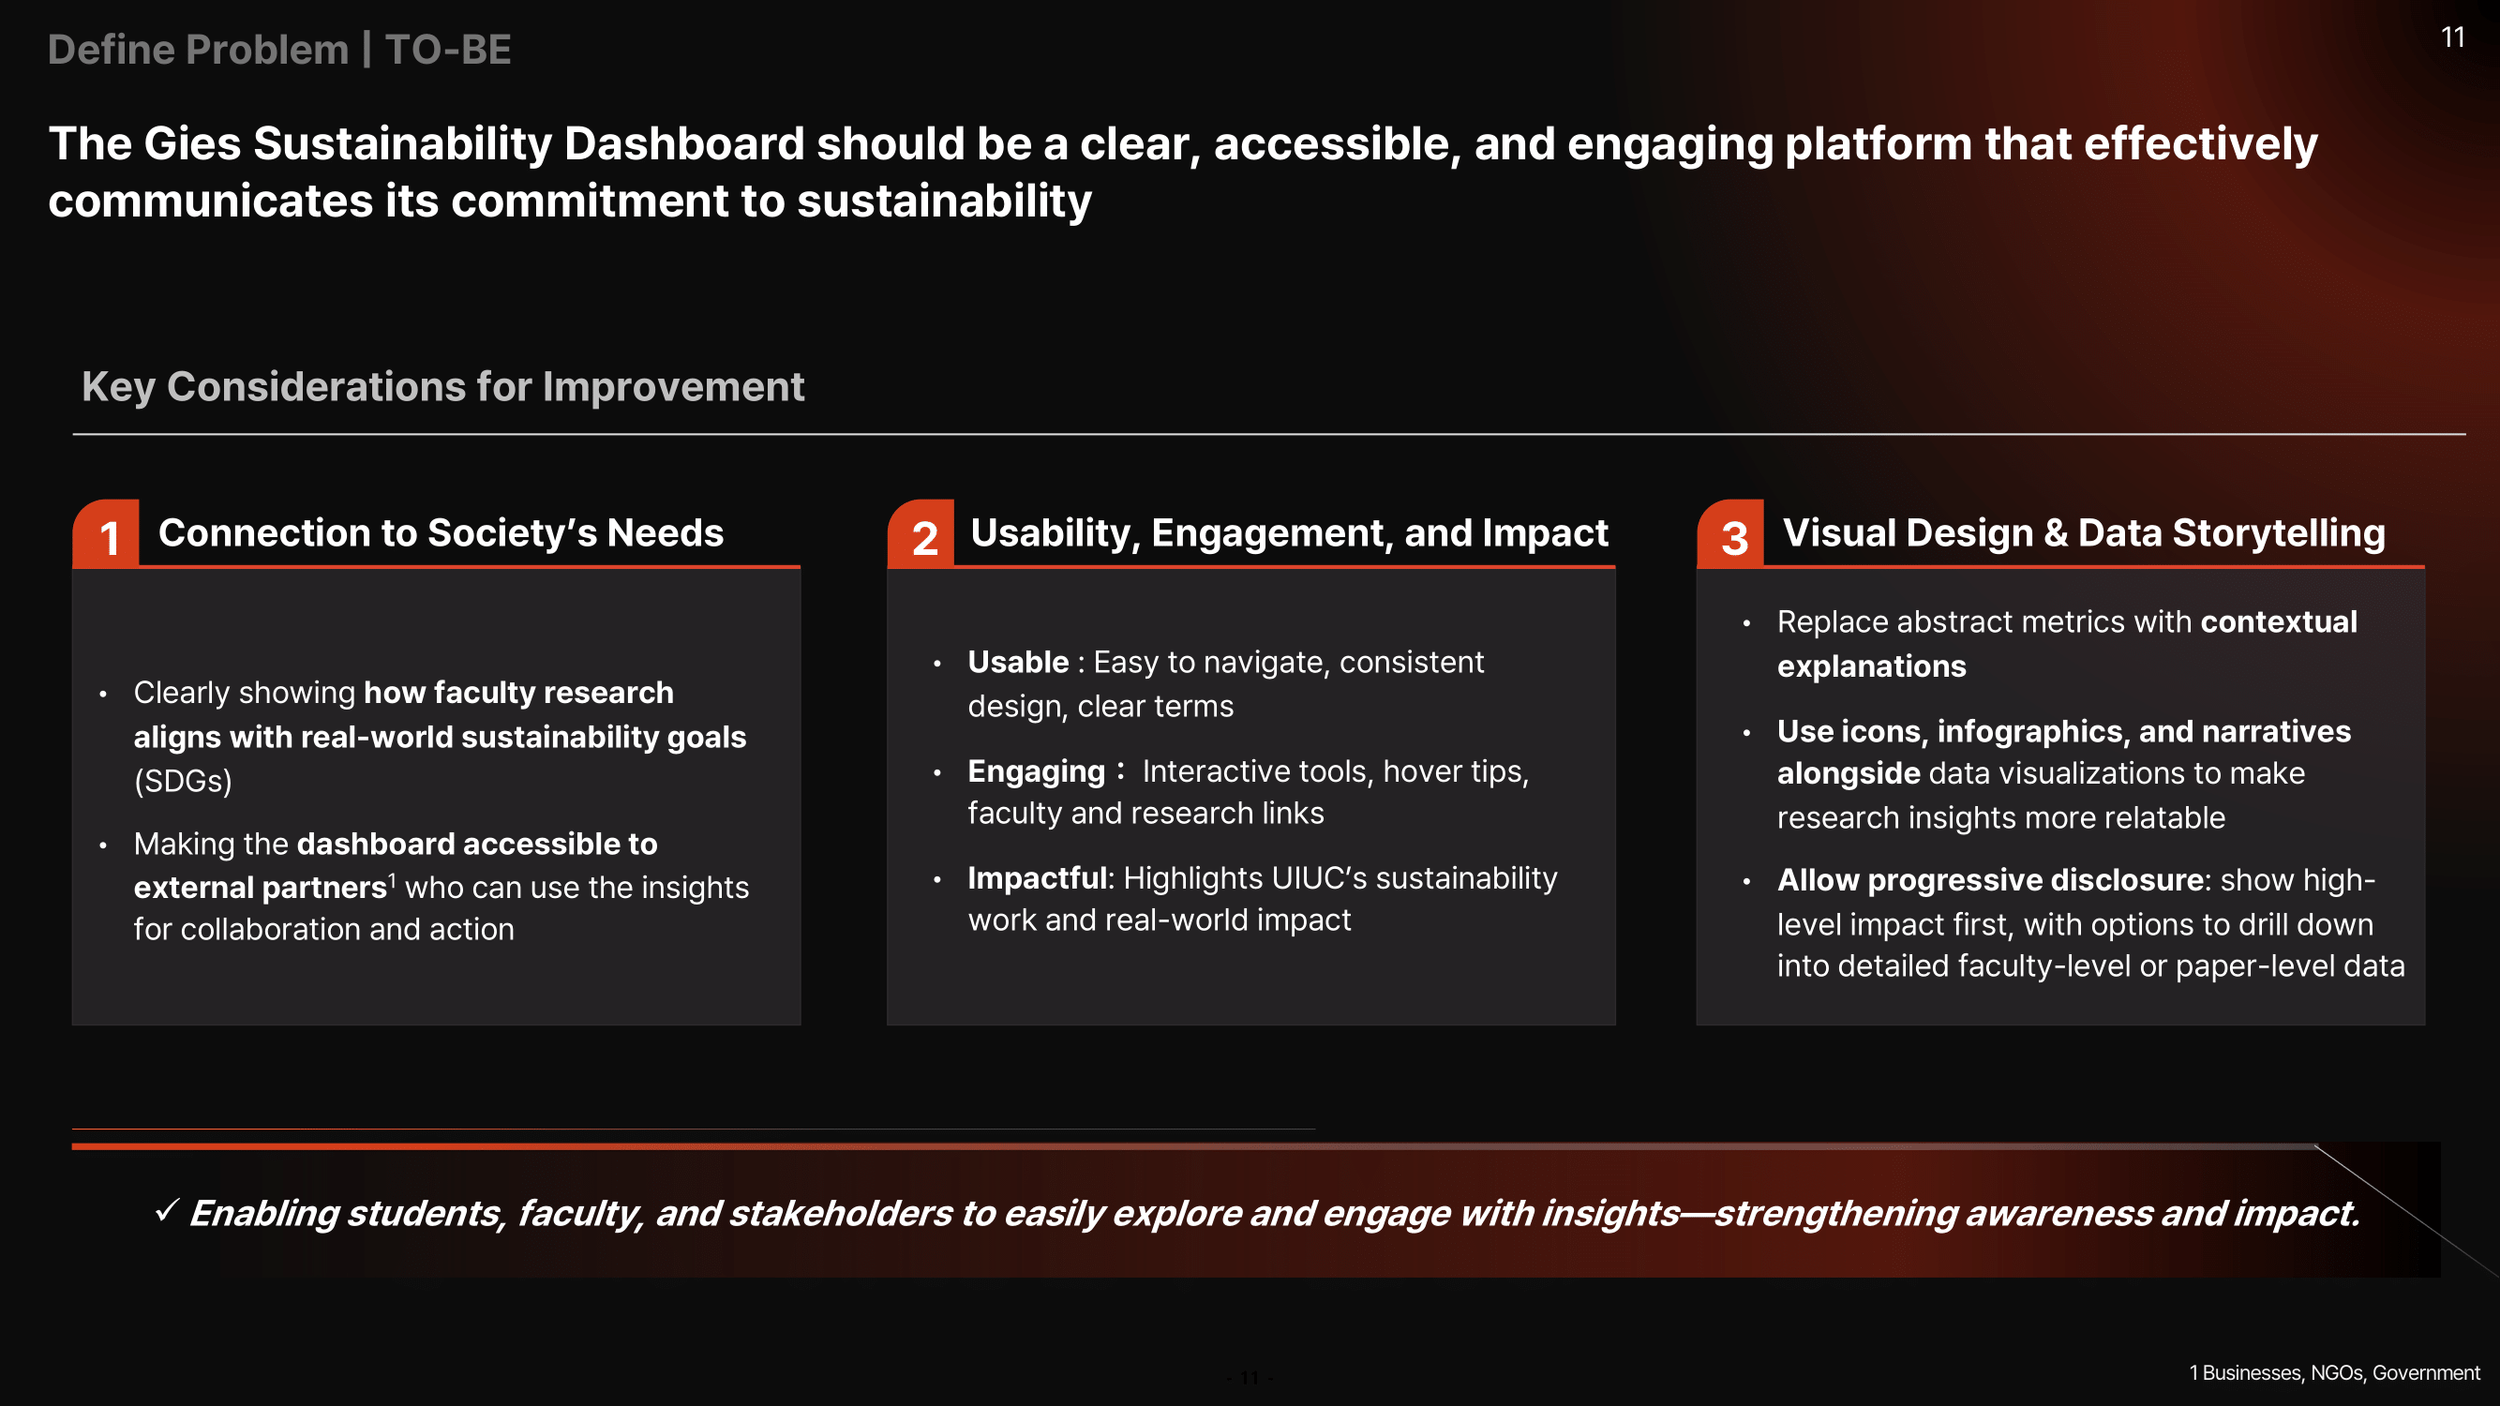
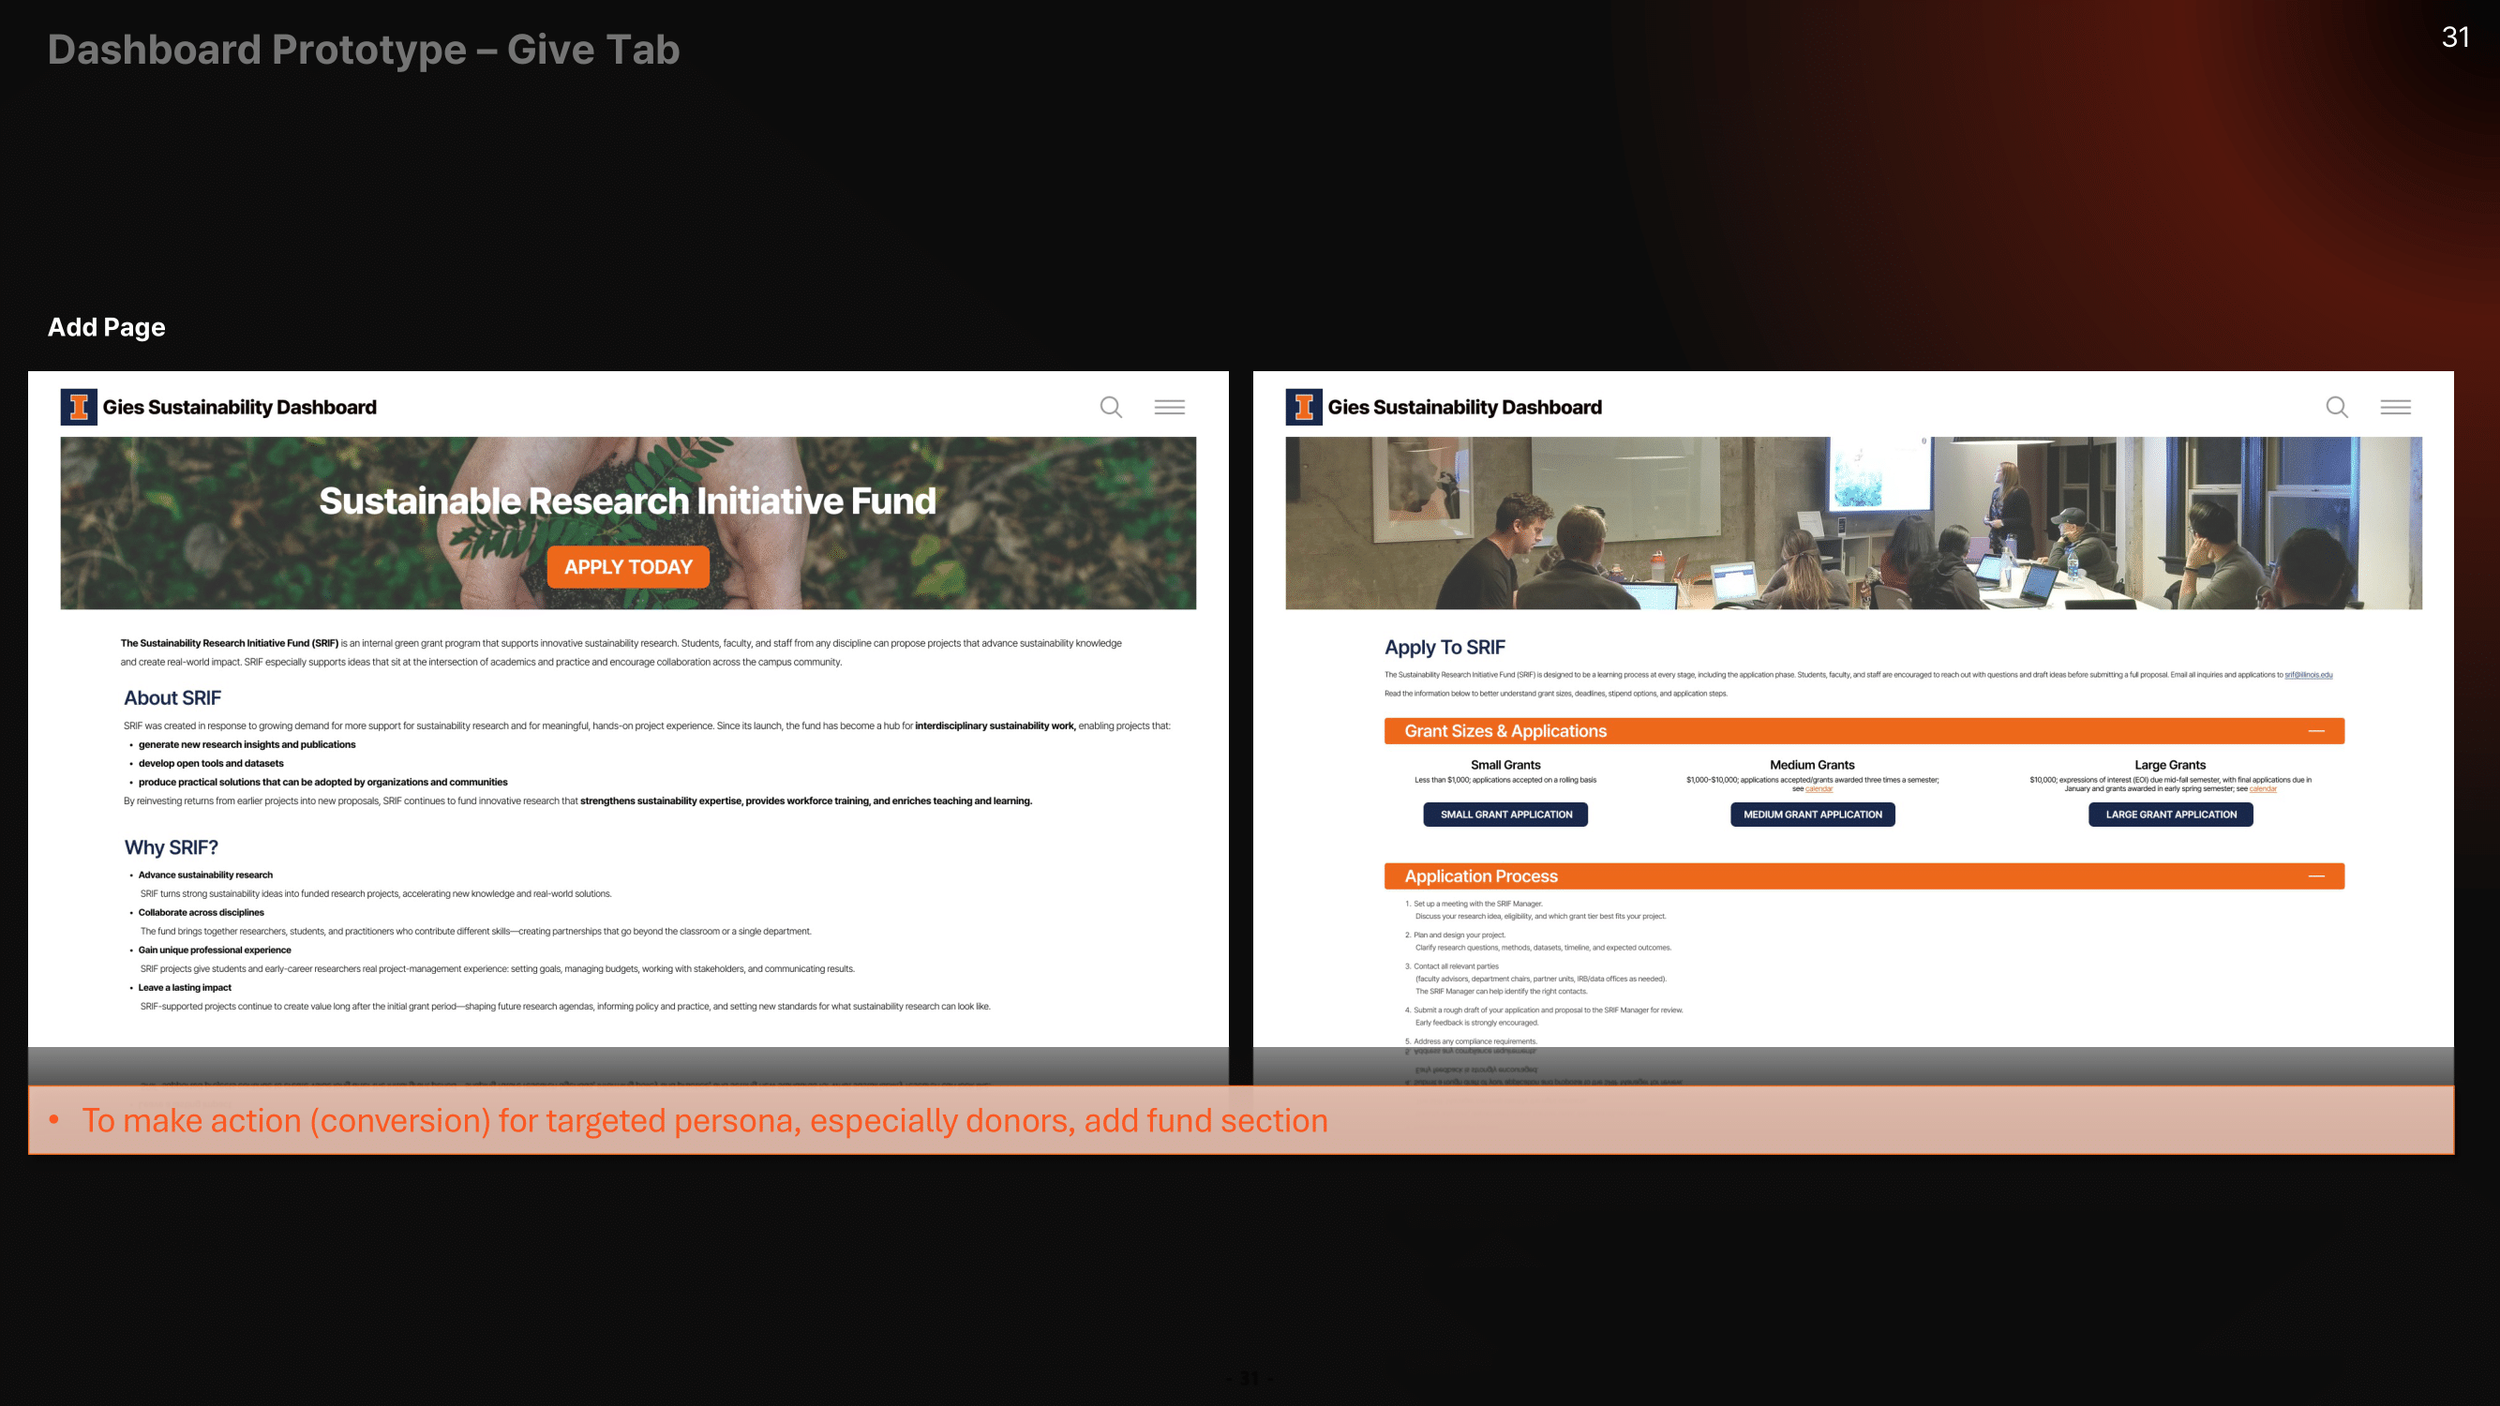
The goal was to transform the dashboard from a static descriptive tool into an accessible, engaging, and stakeholder-centered sustainability intelligence platform.
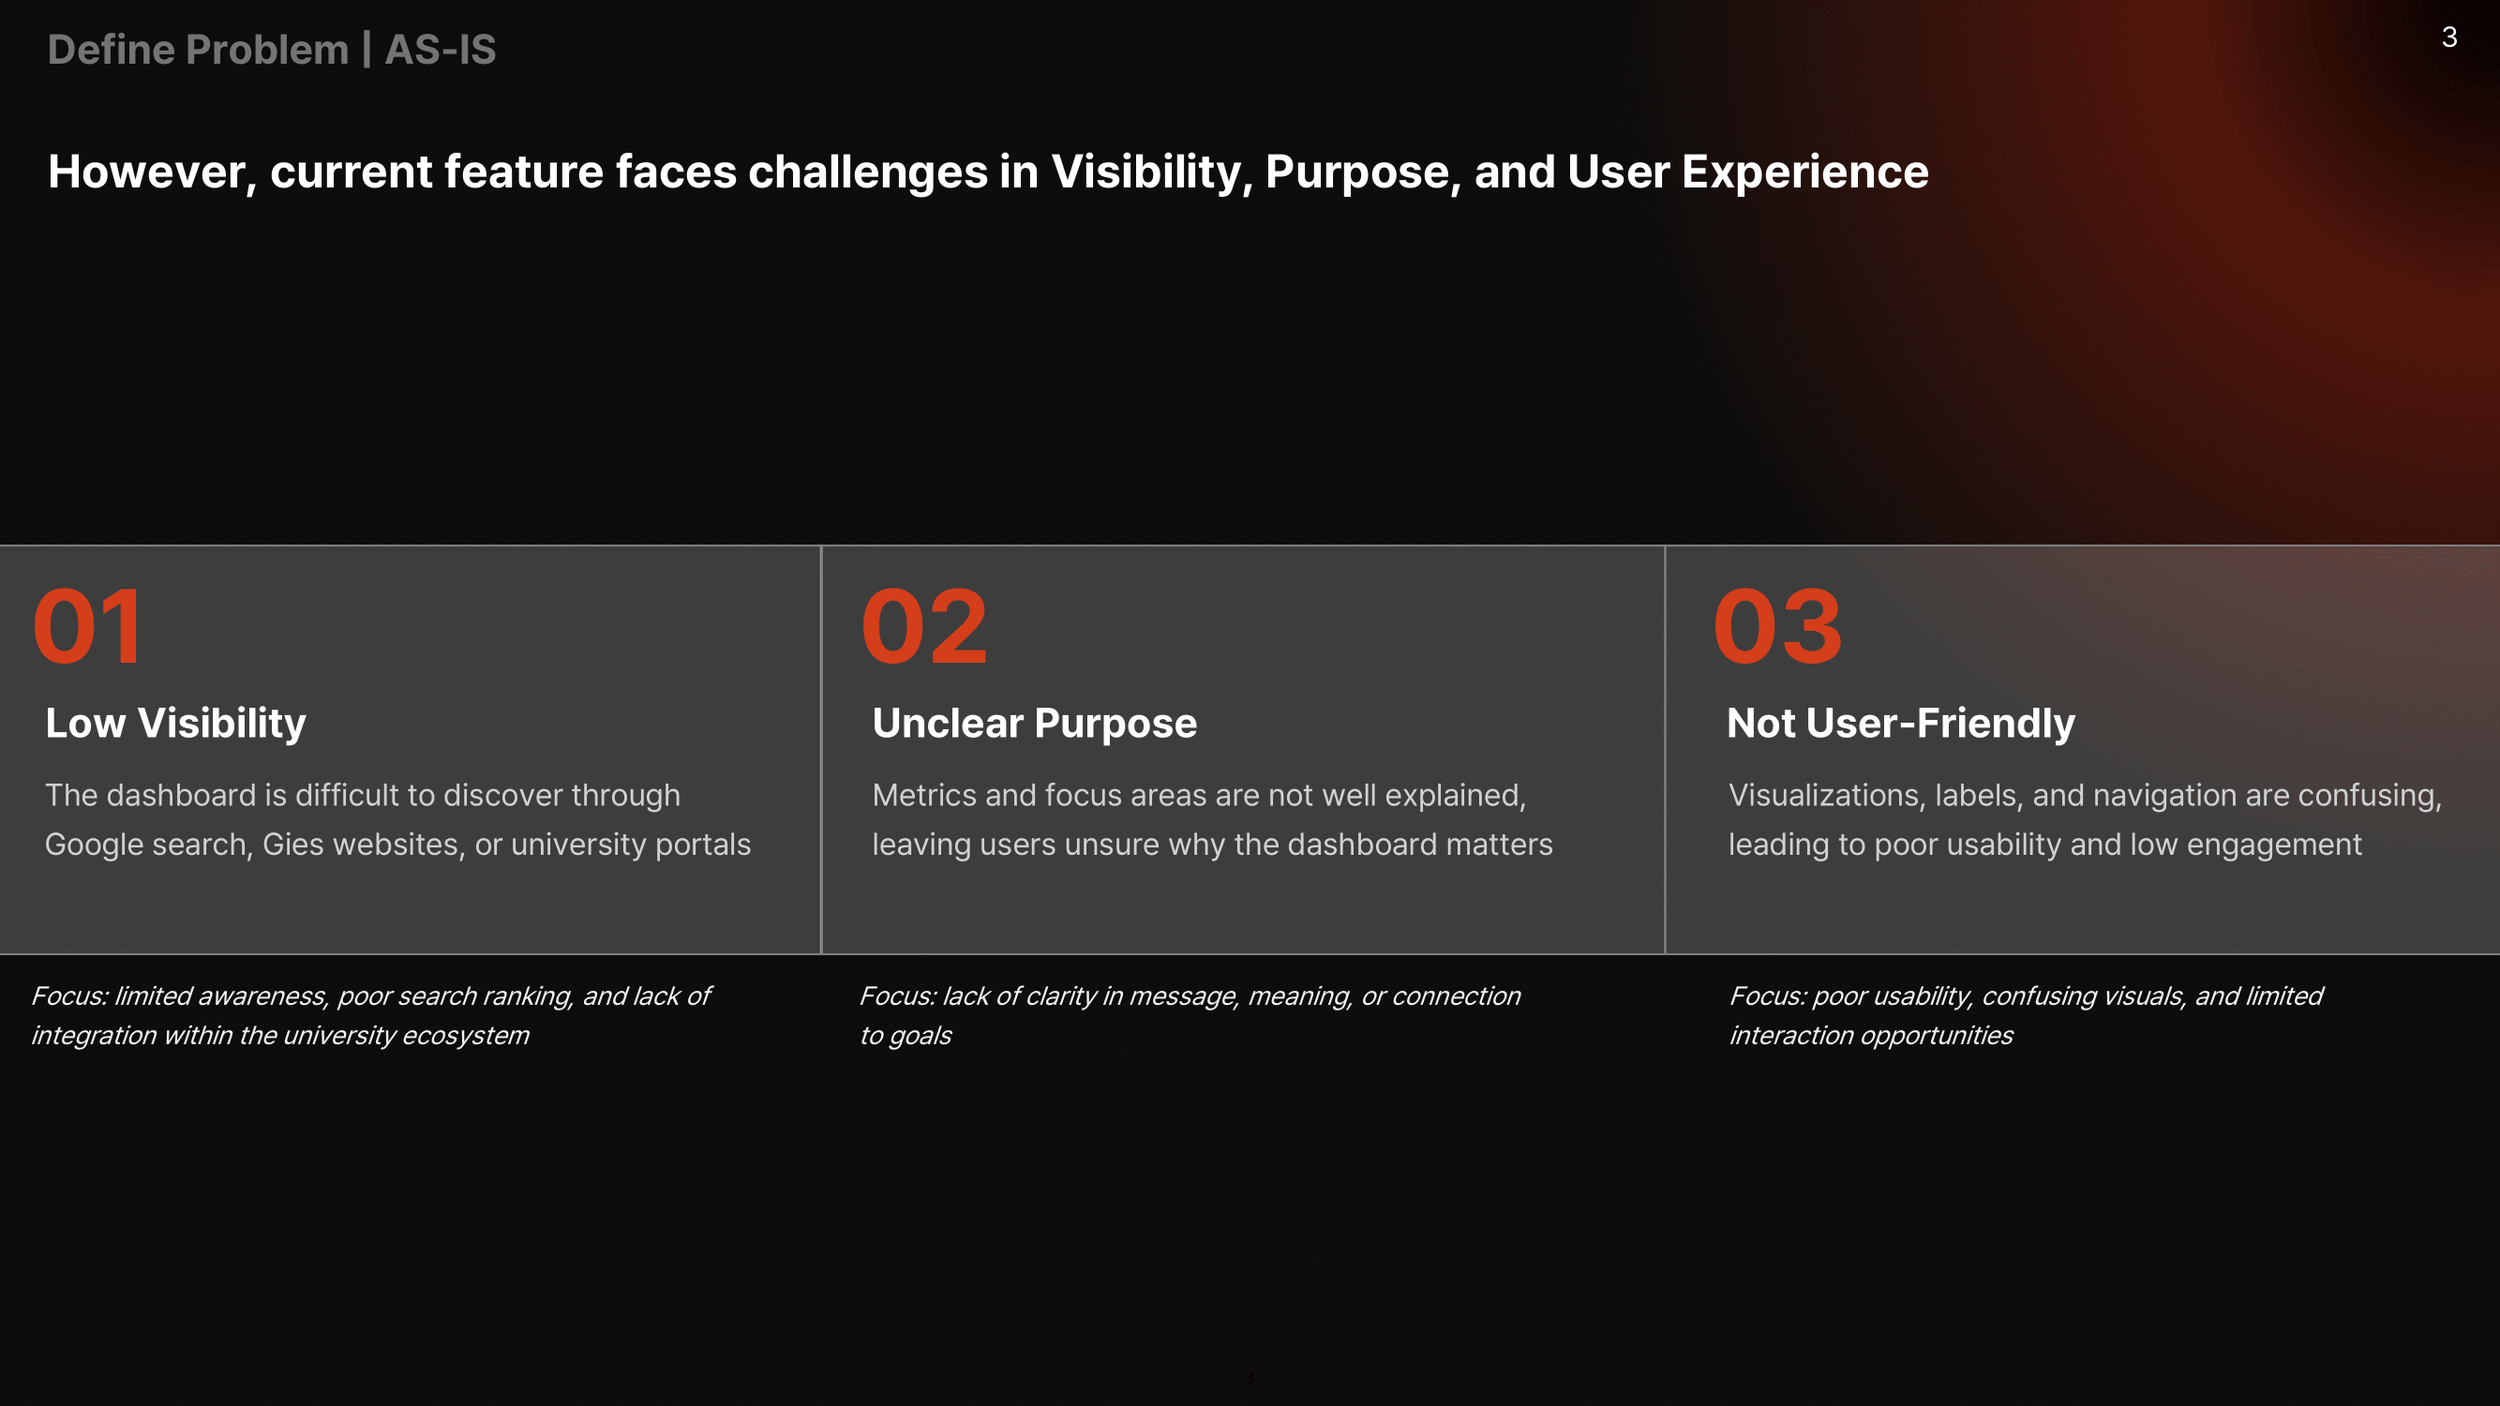
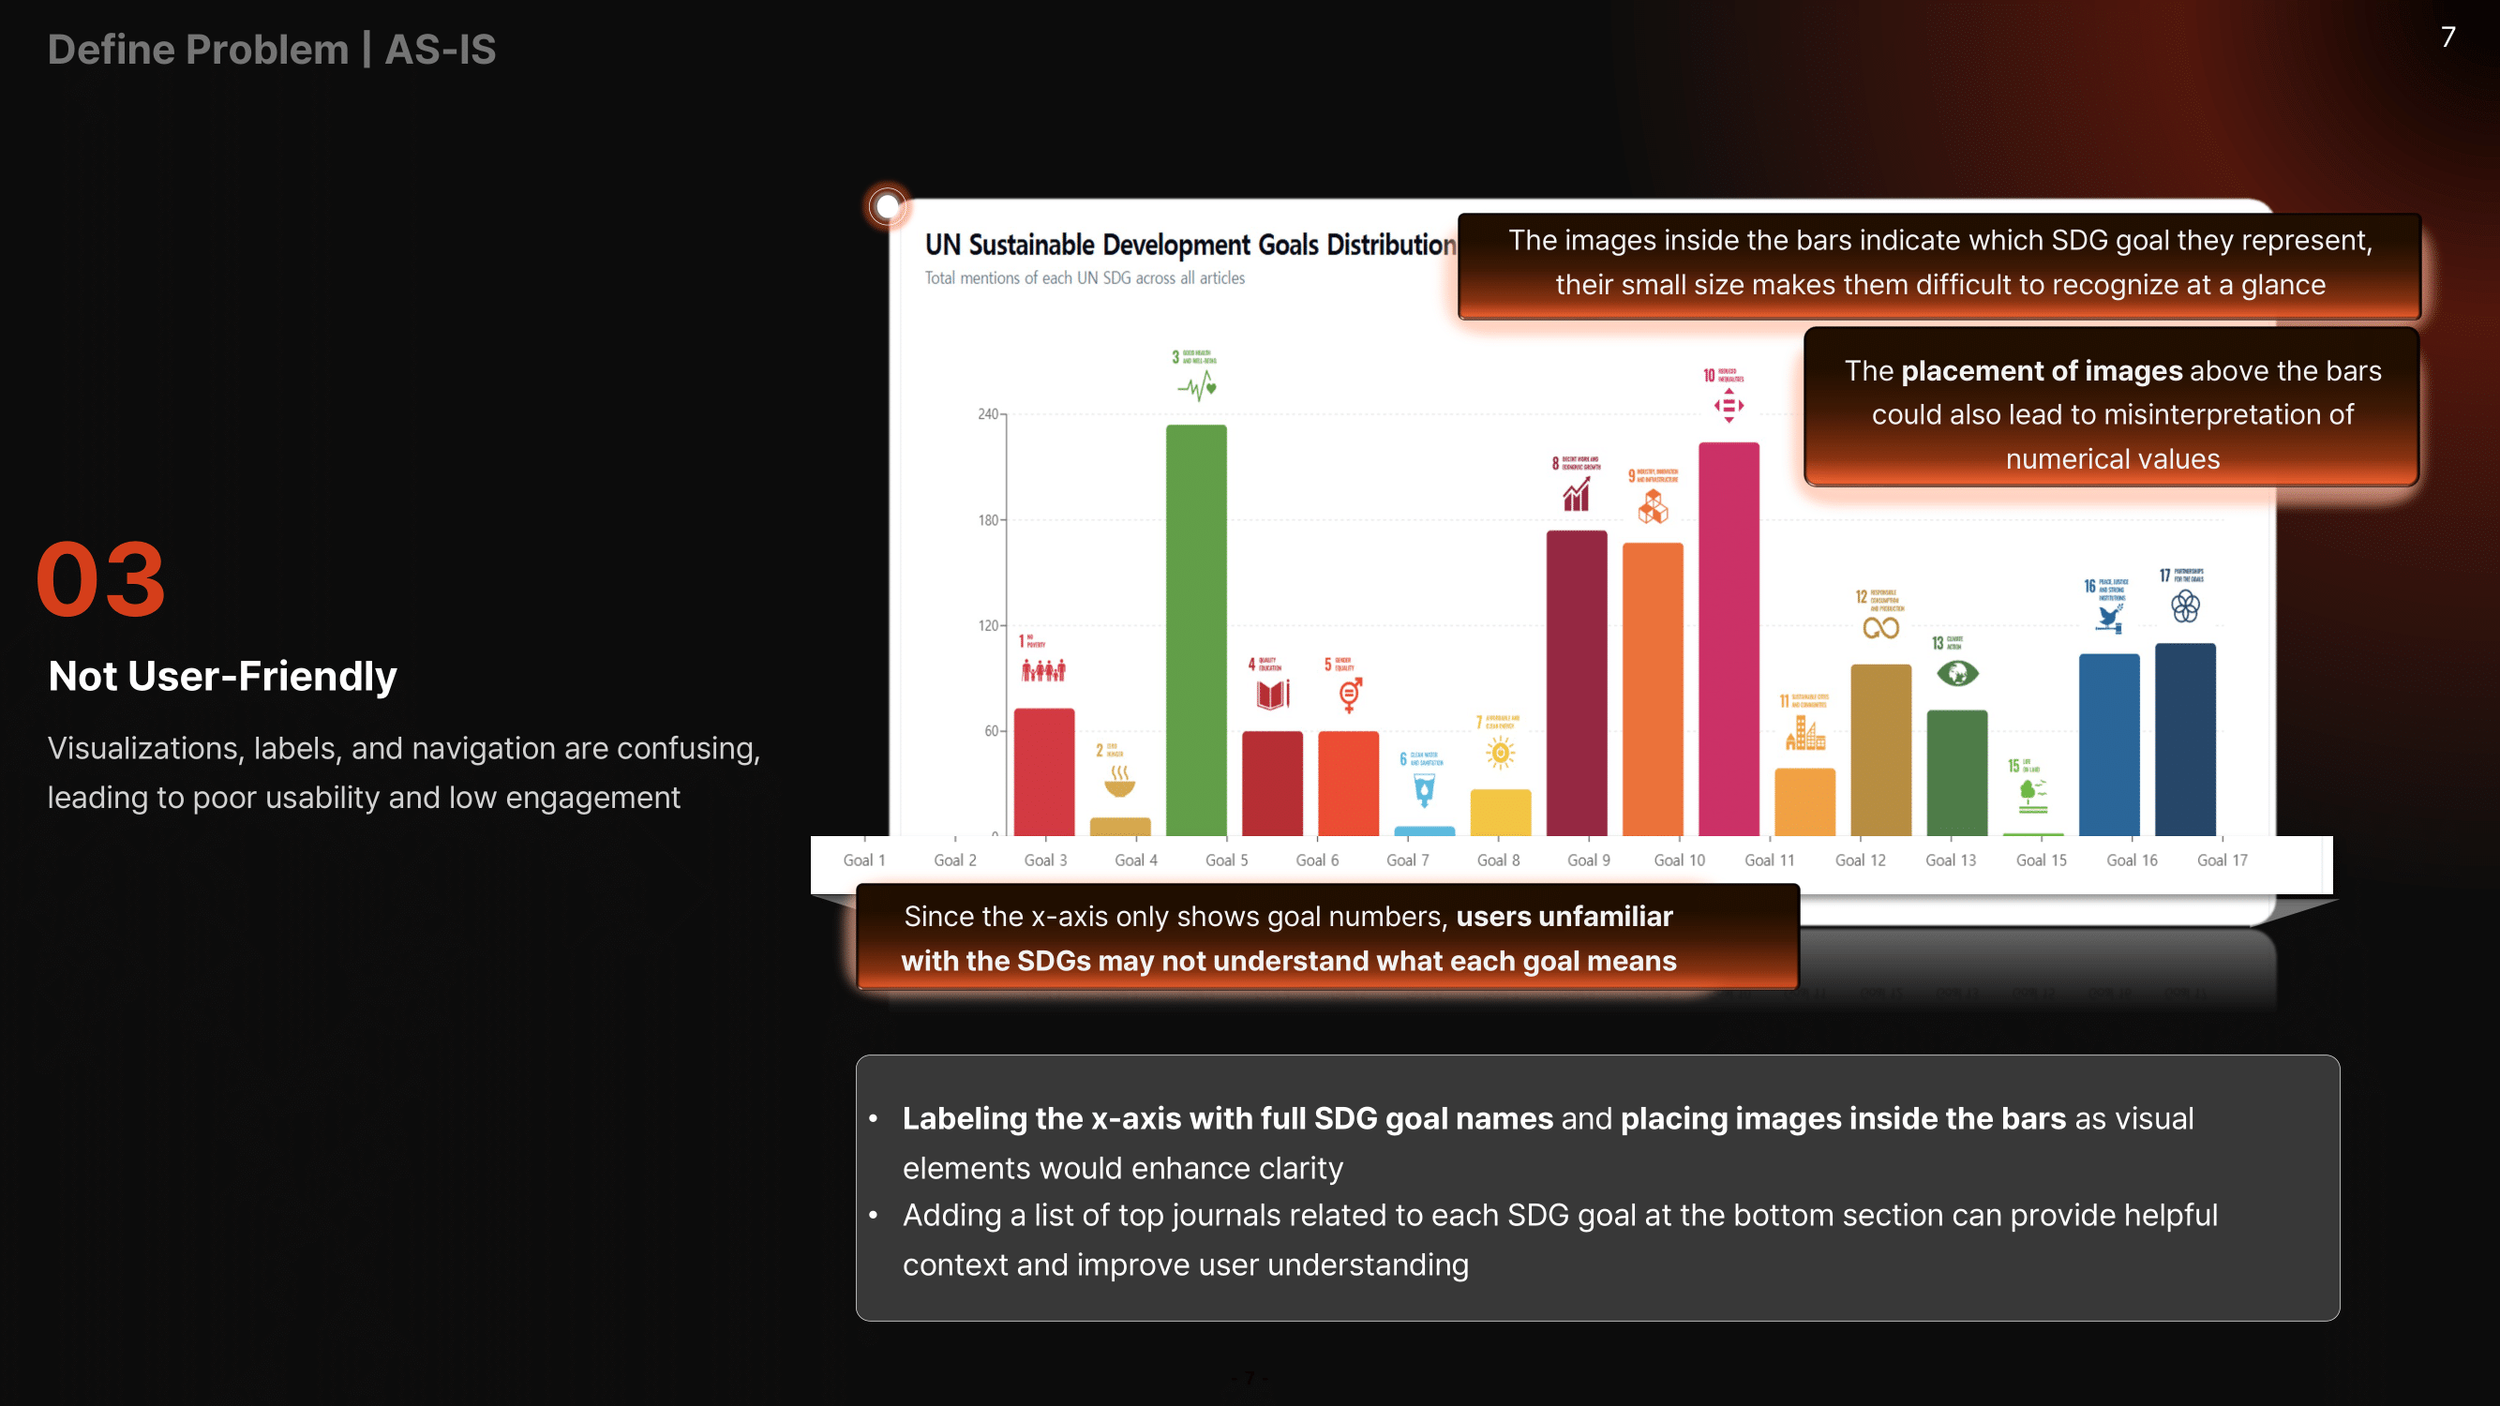
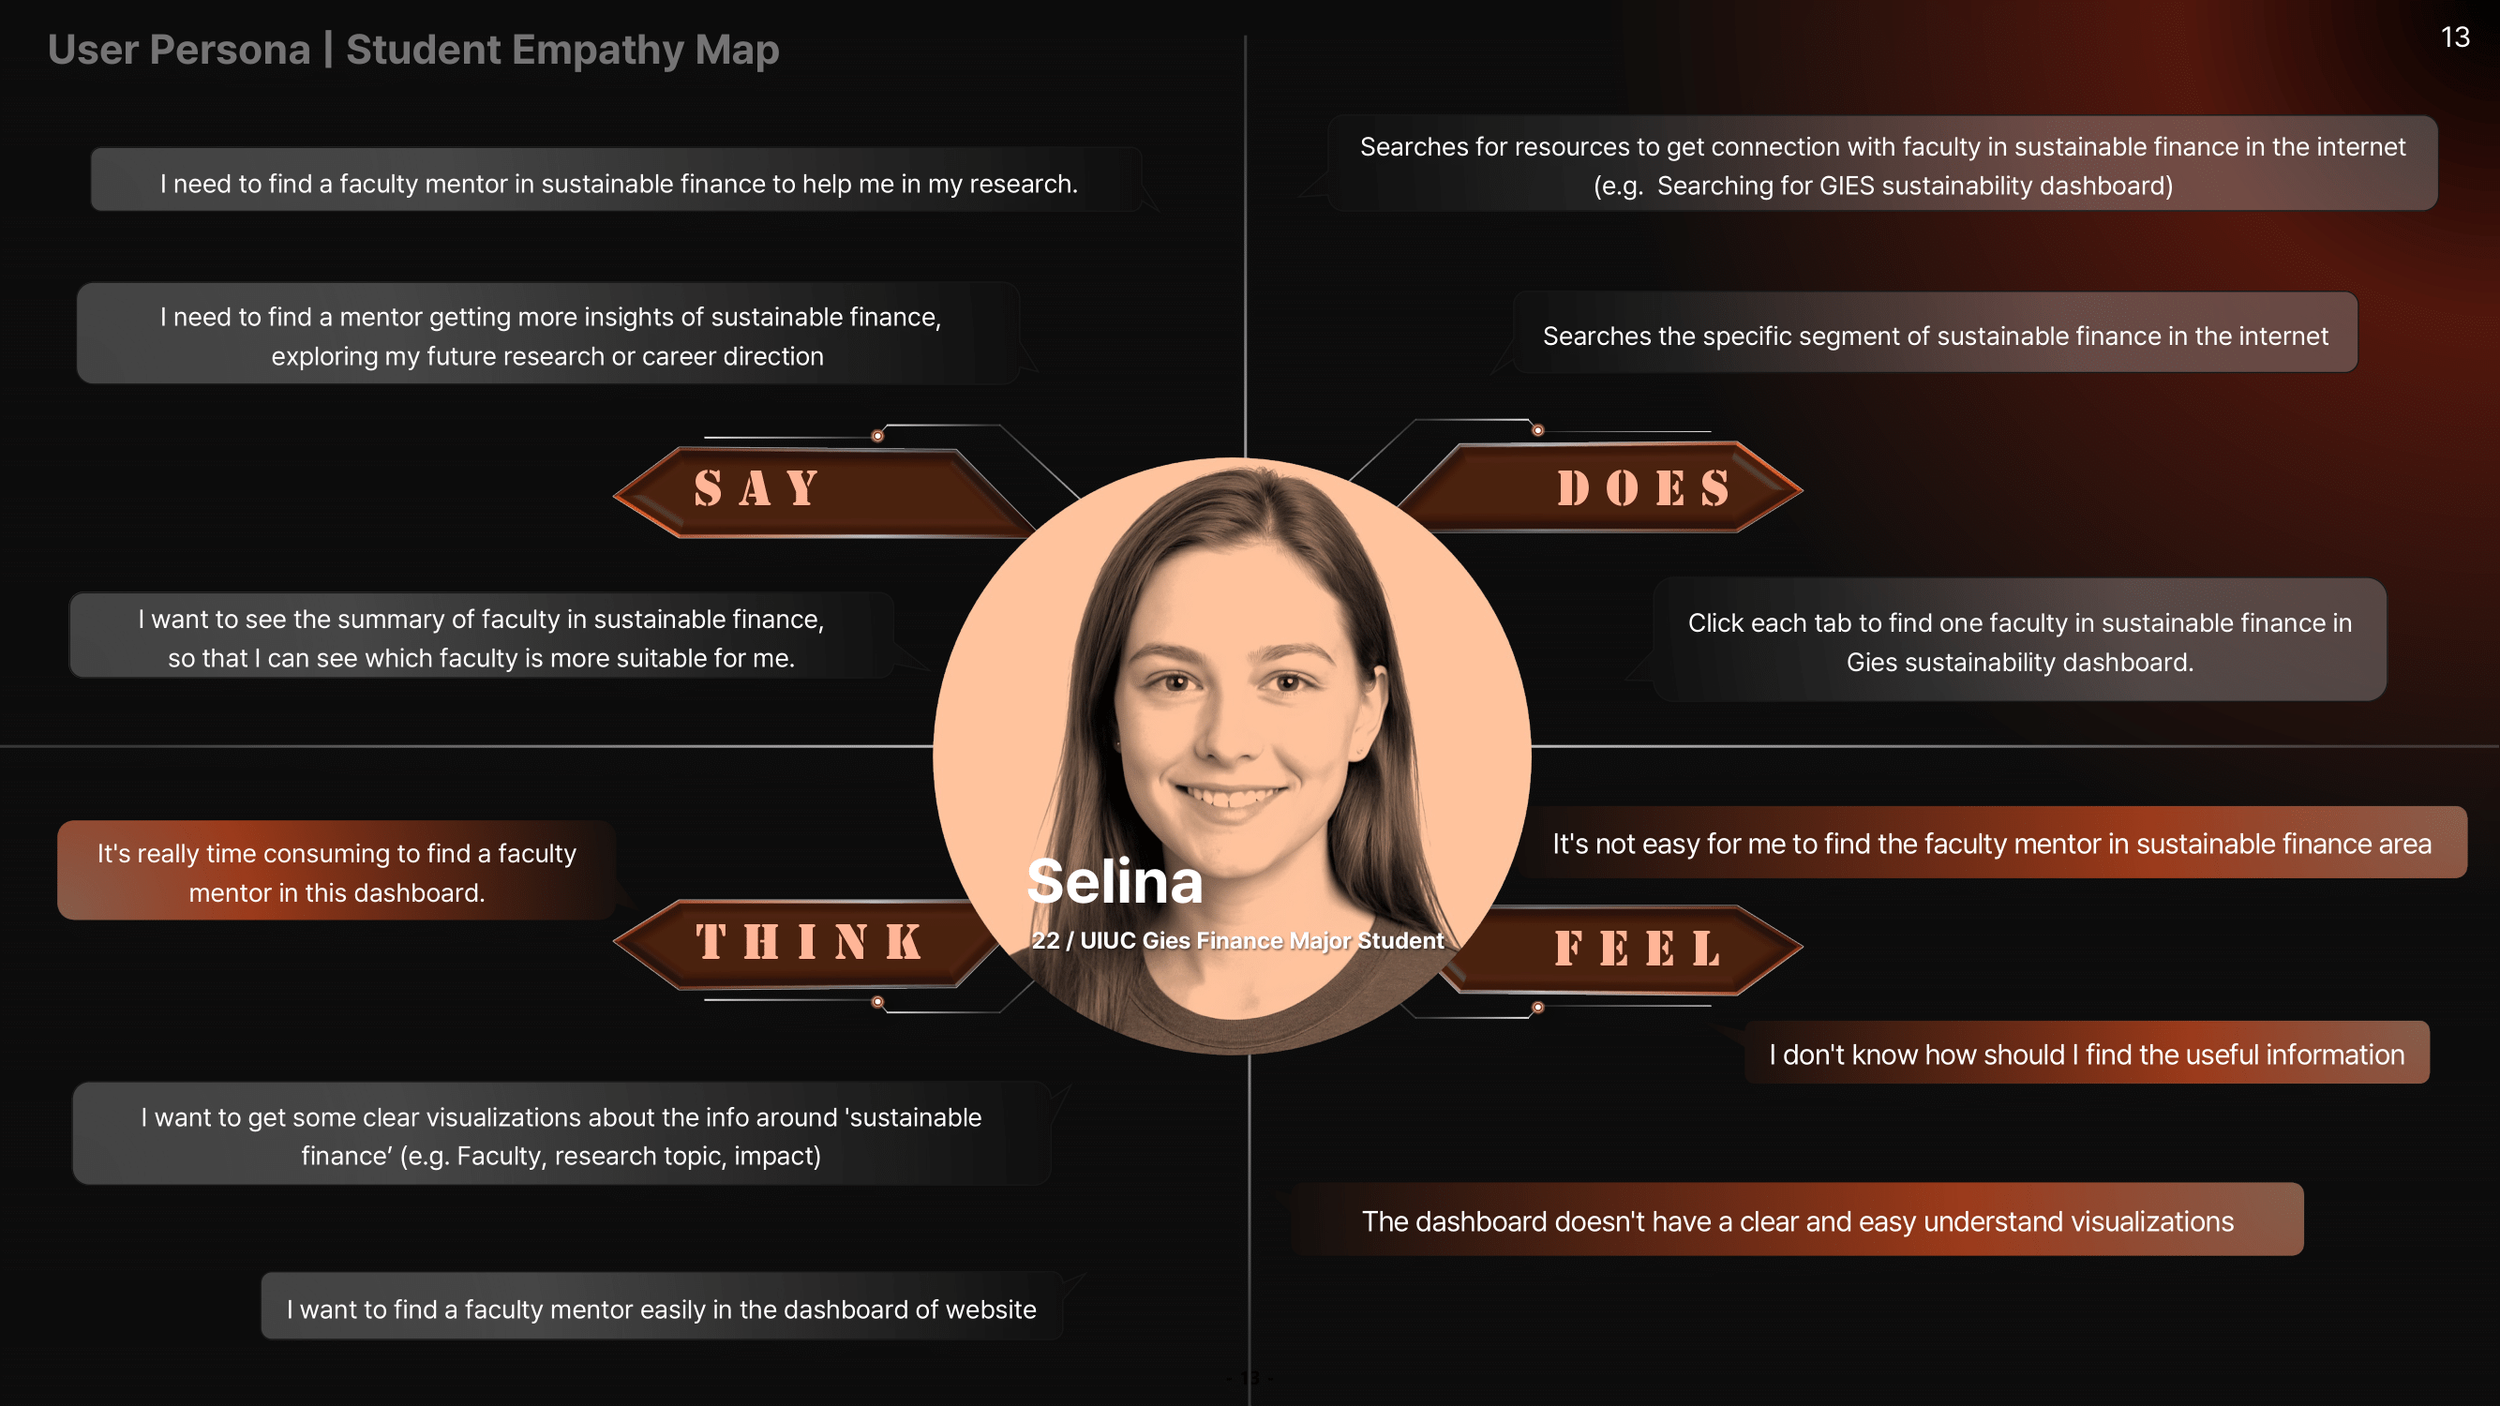
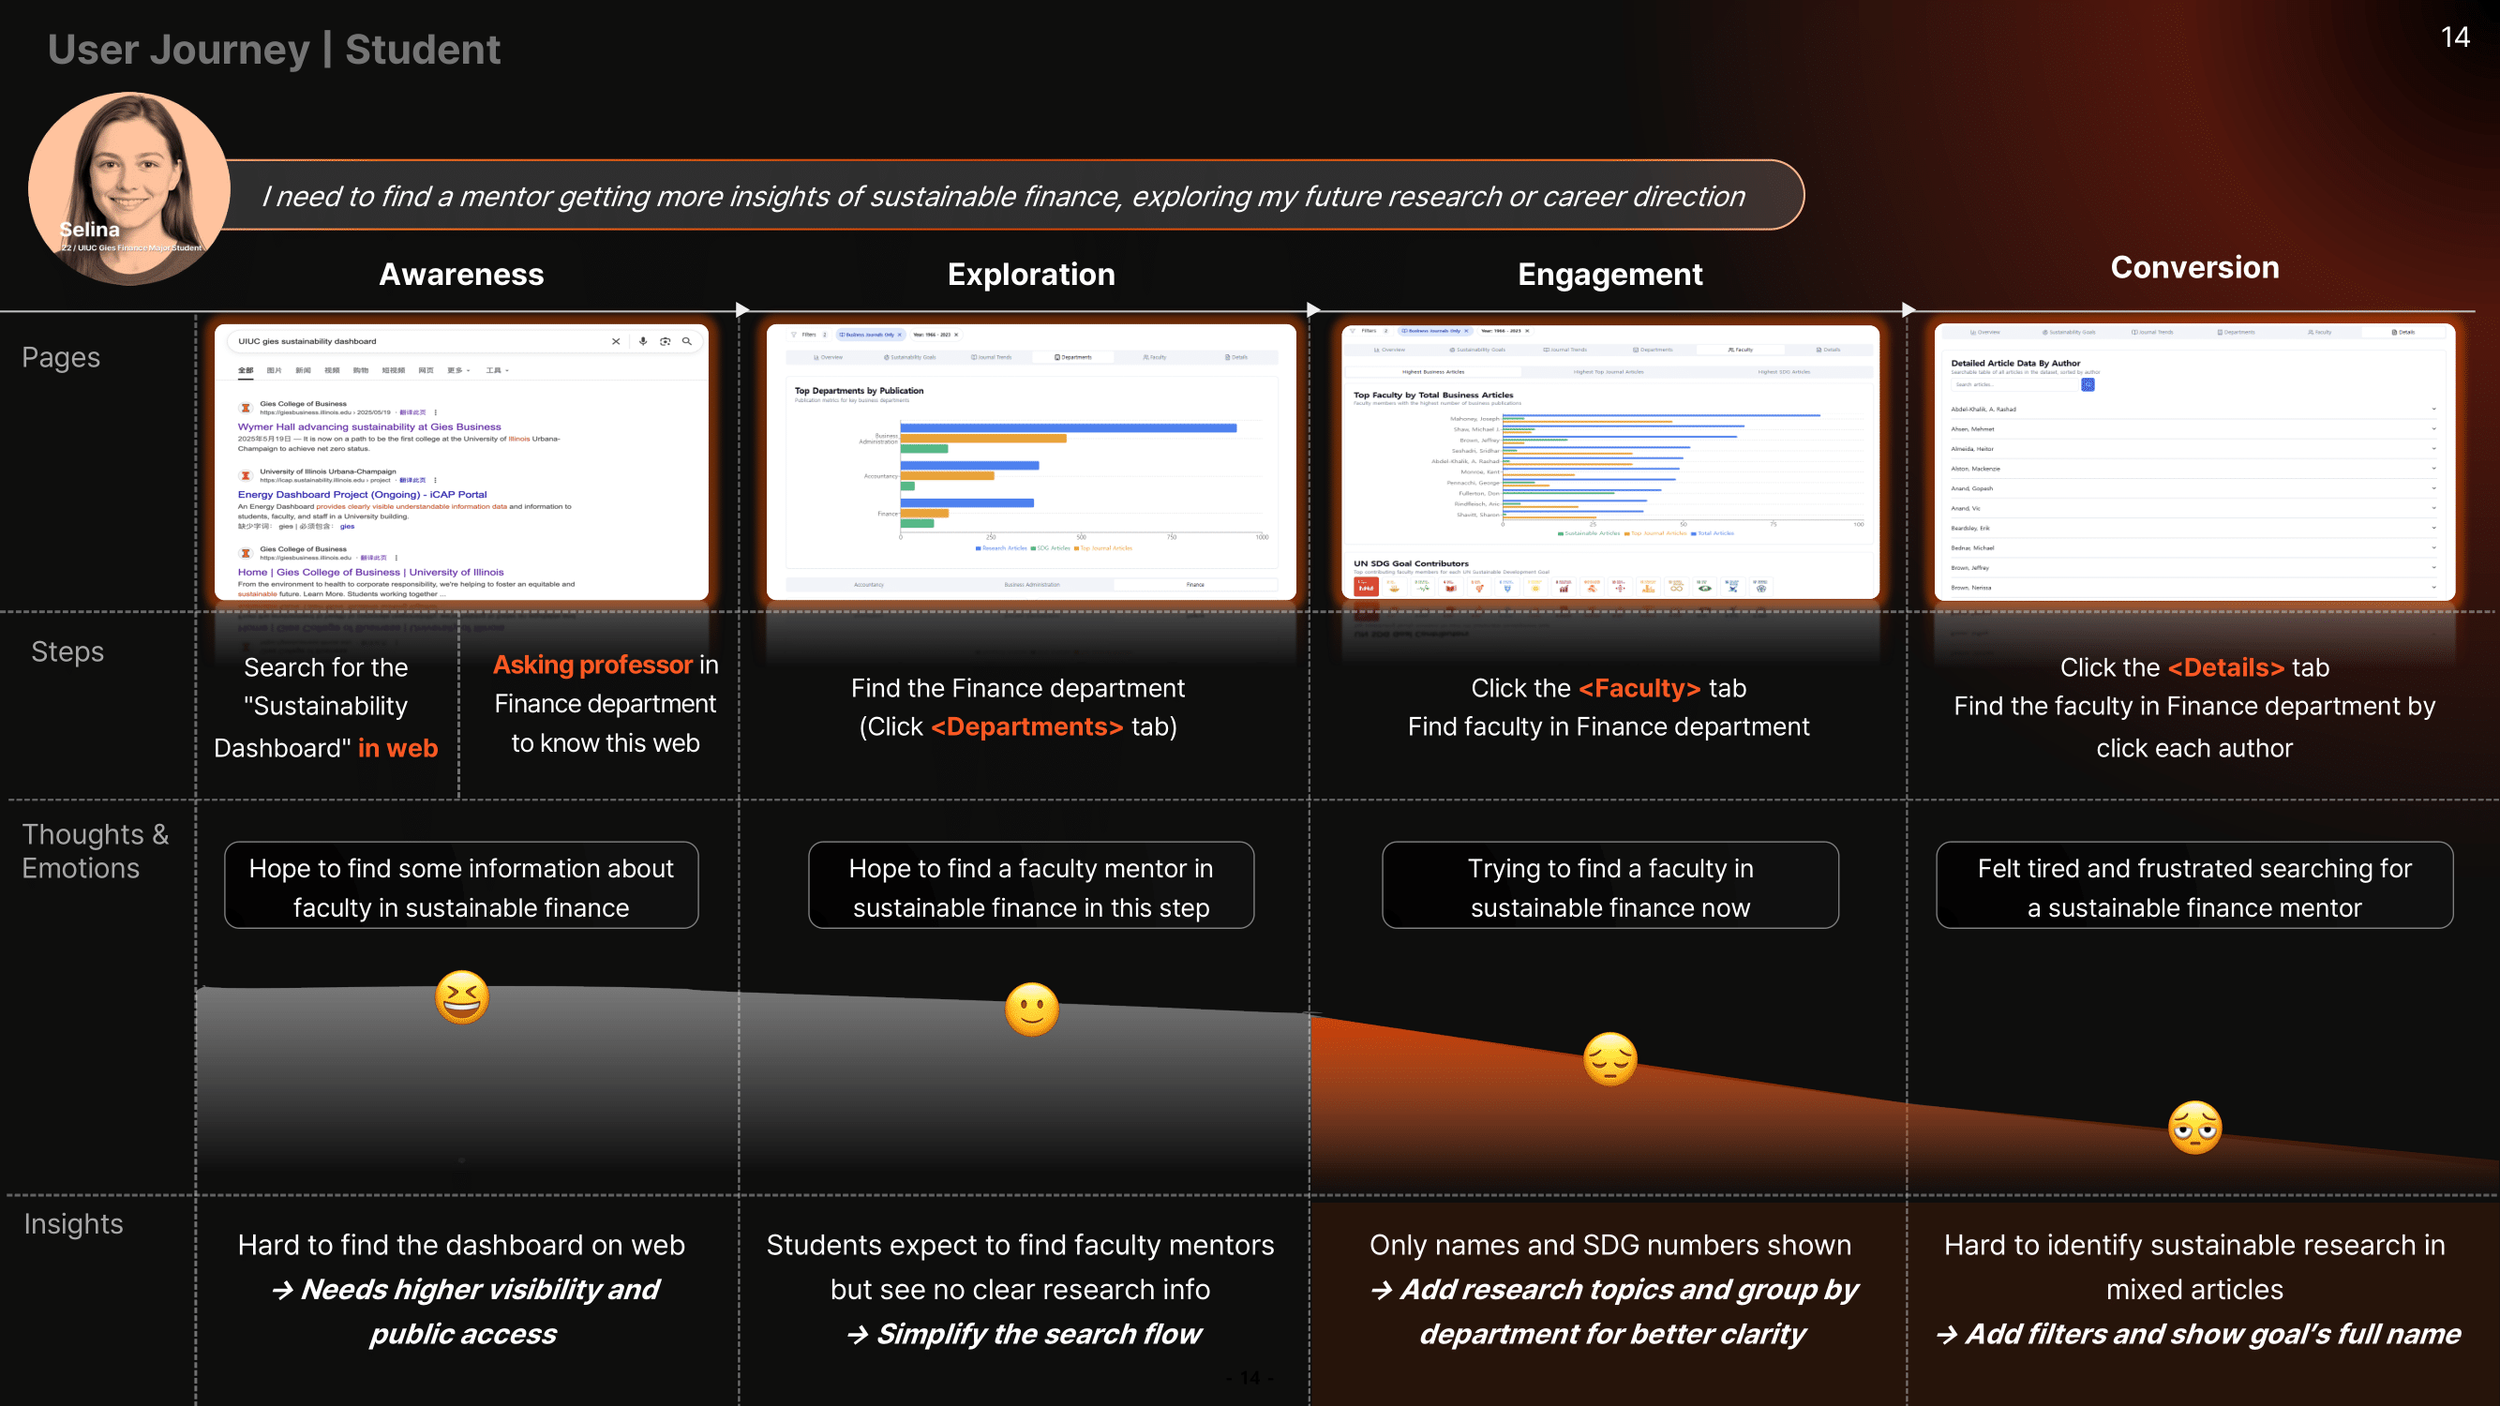
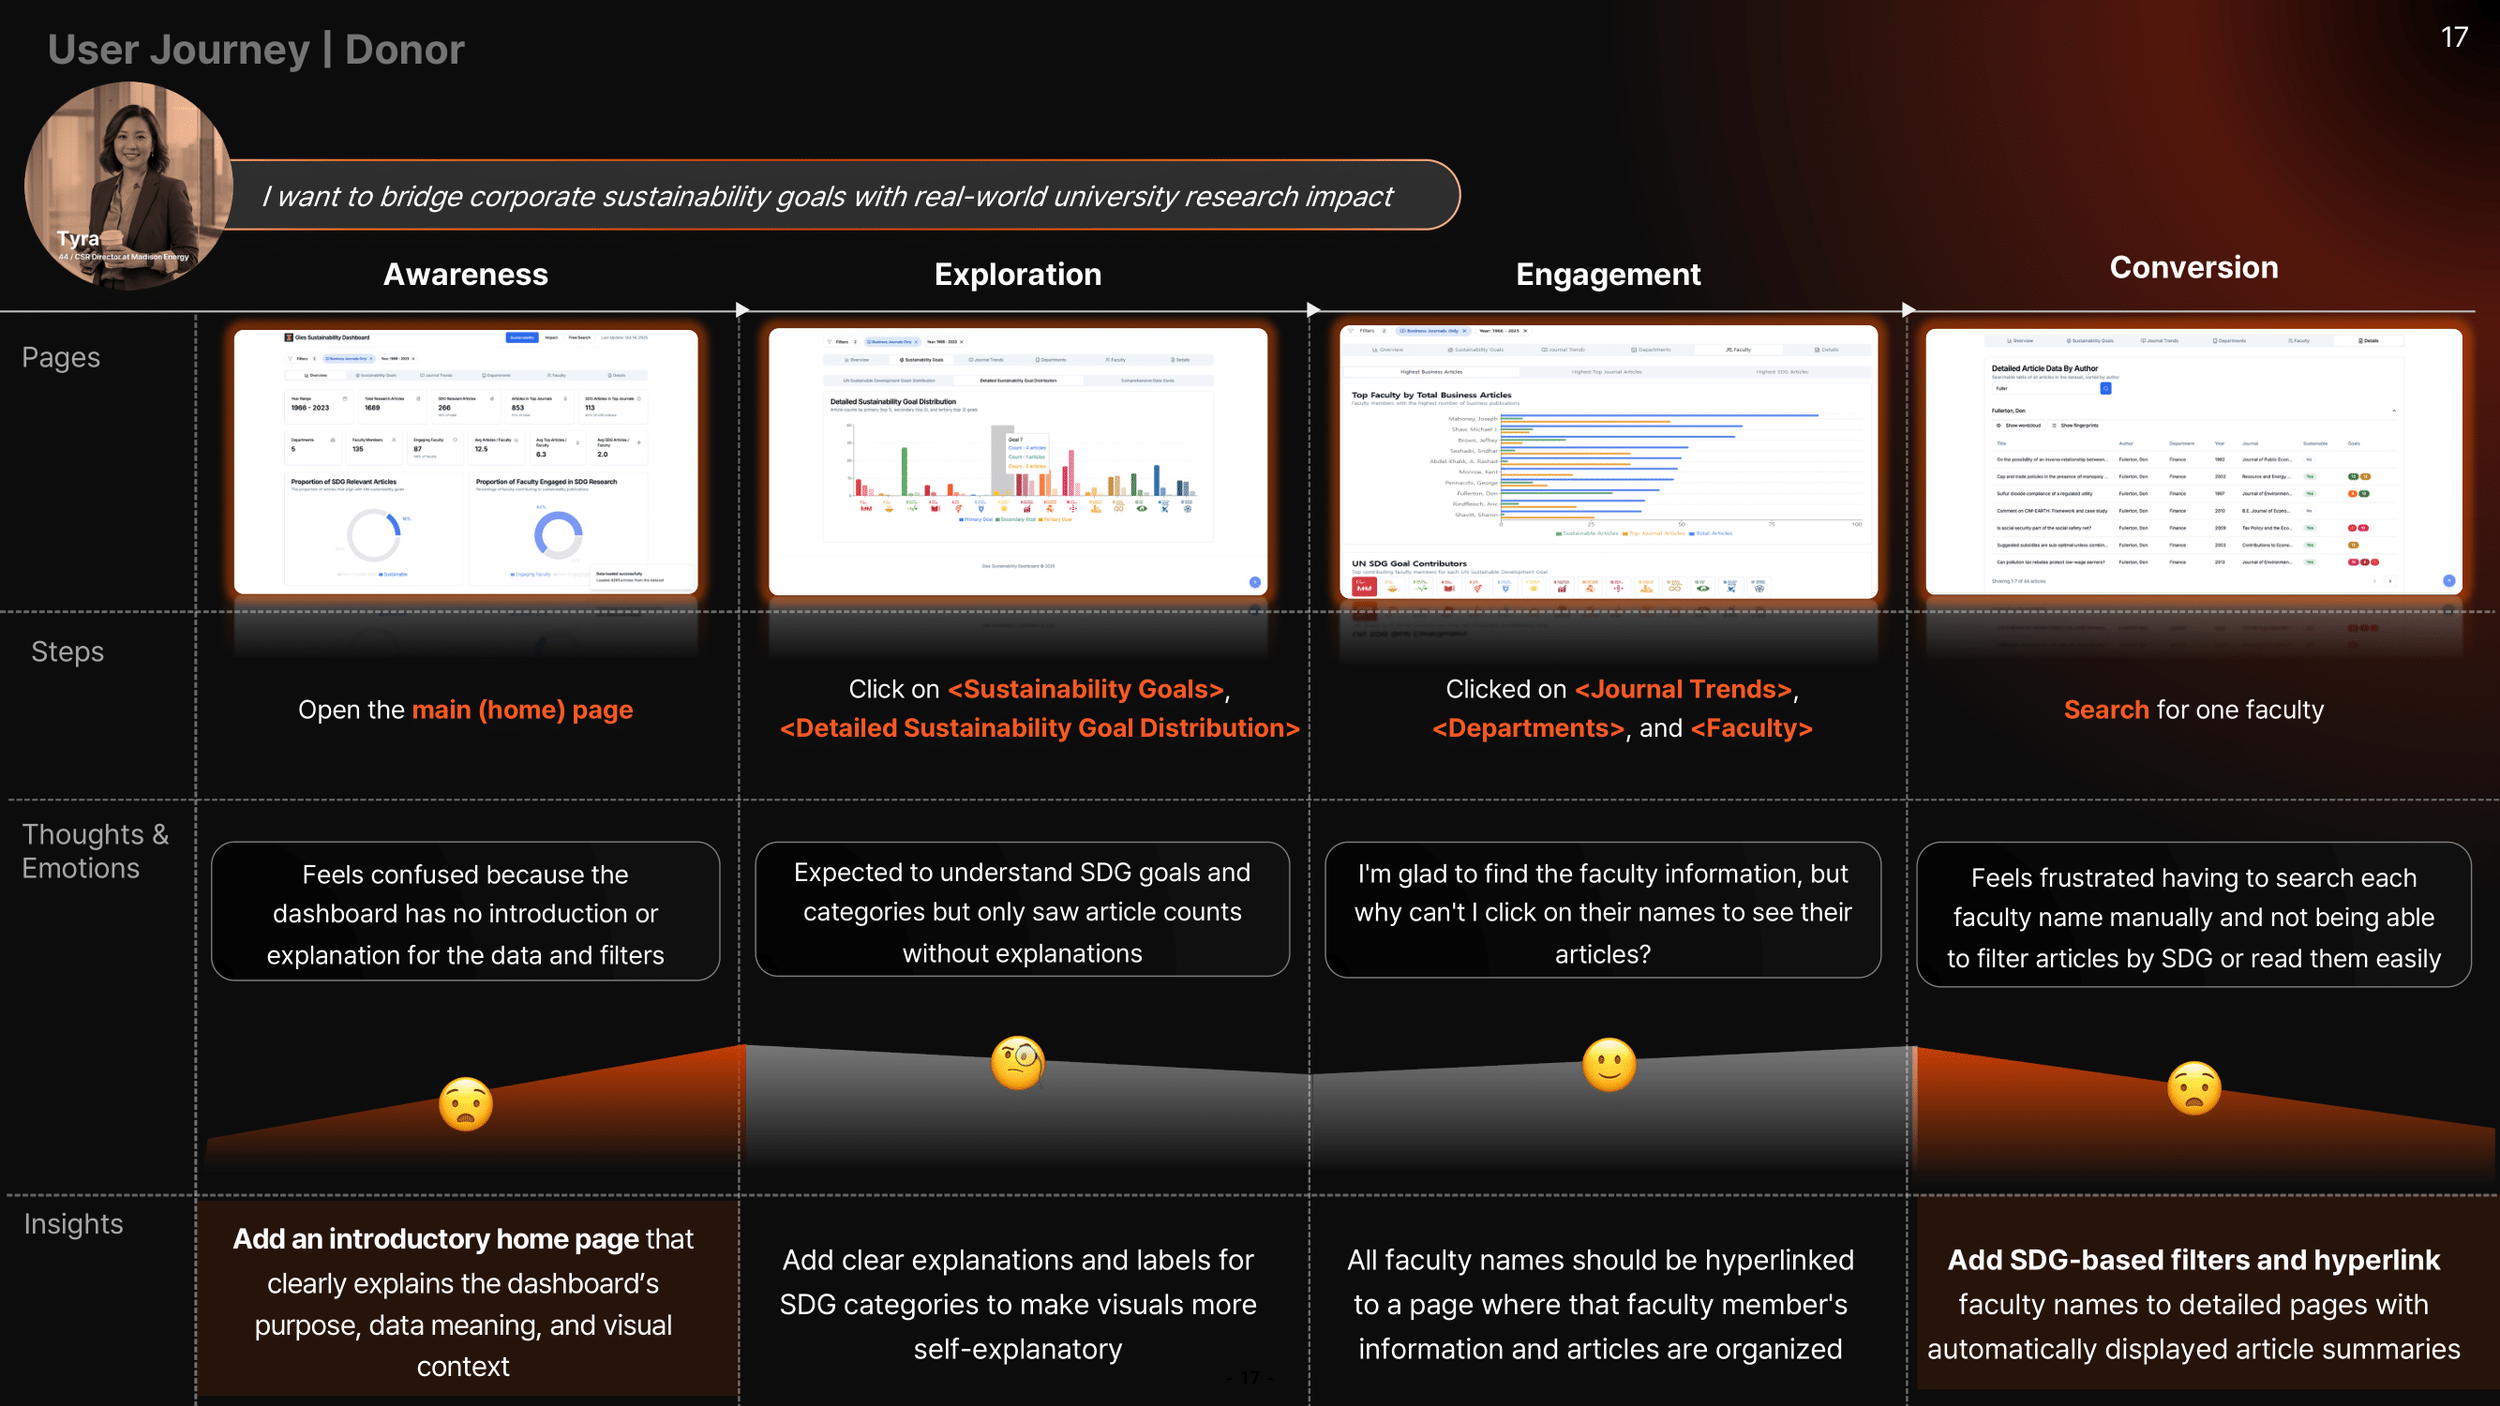
The Problem (AS-IS Analysis) - Key Issues
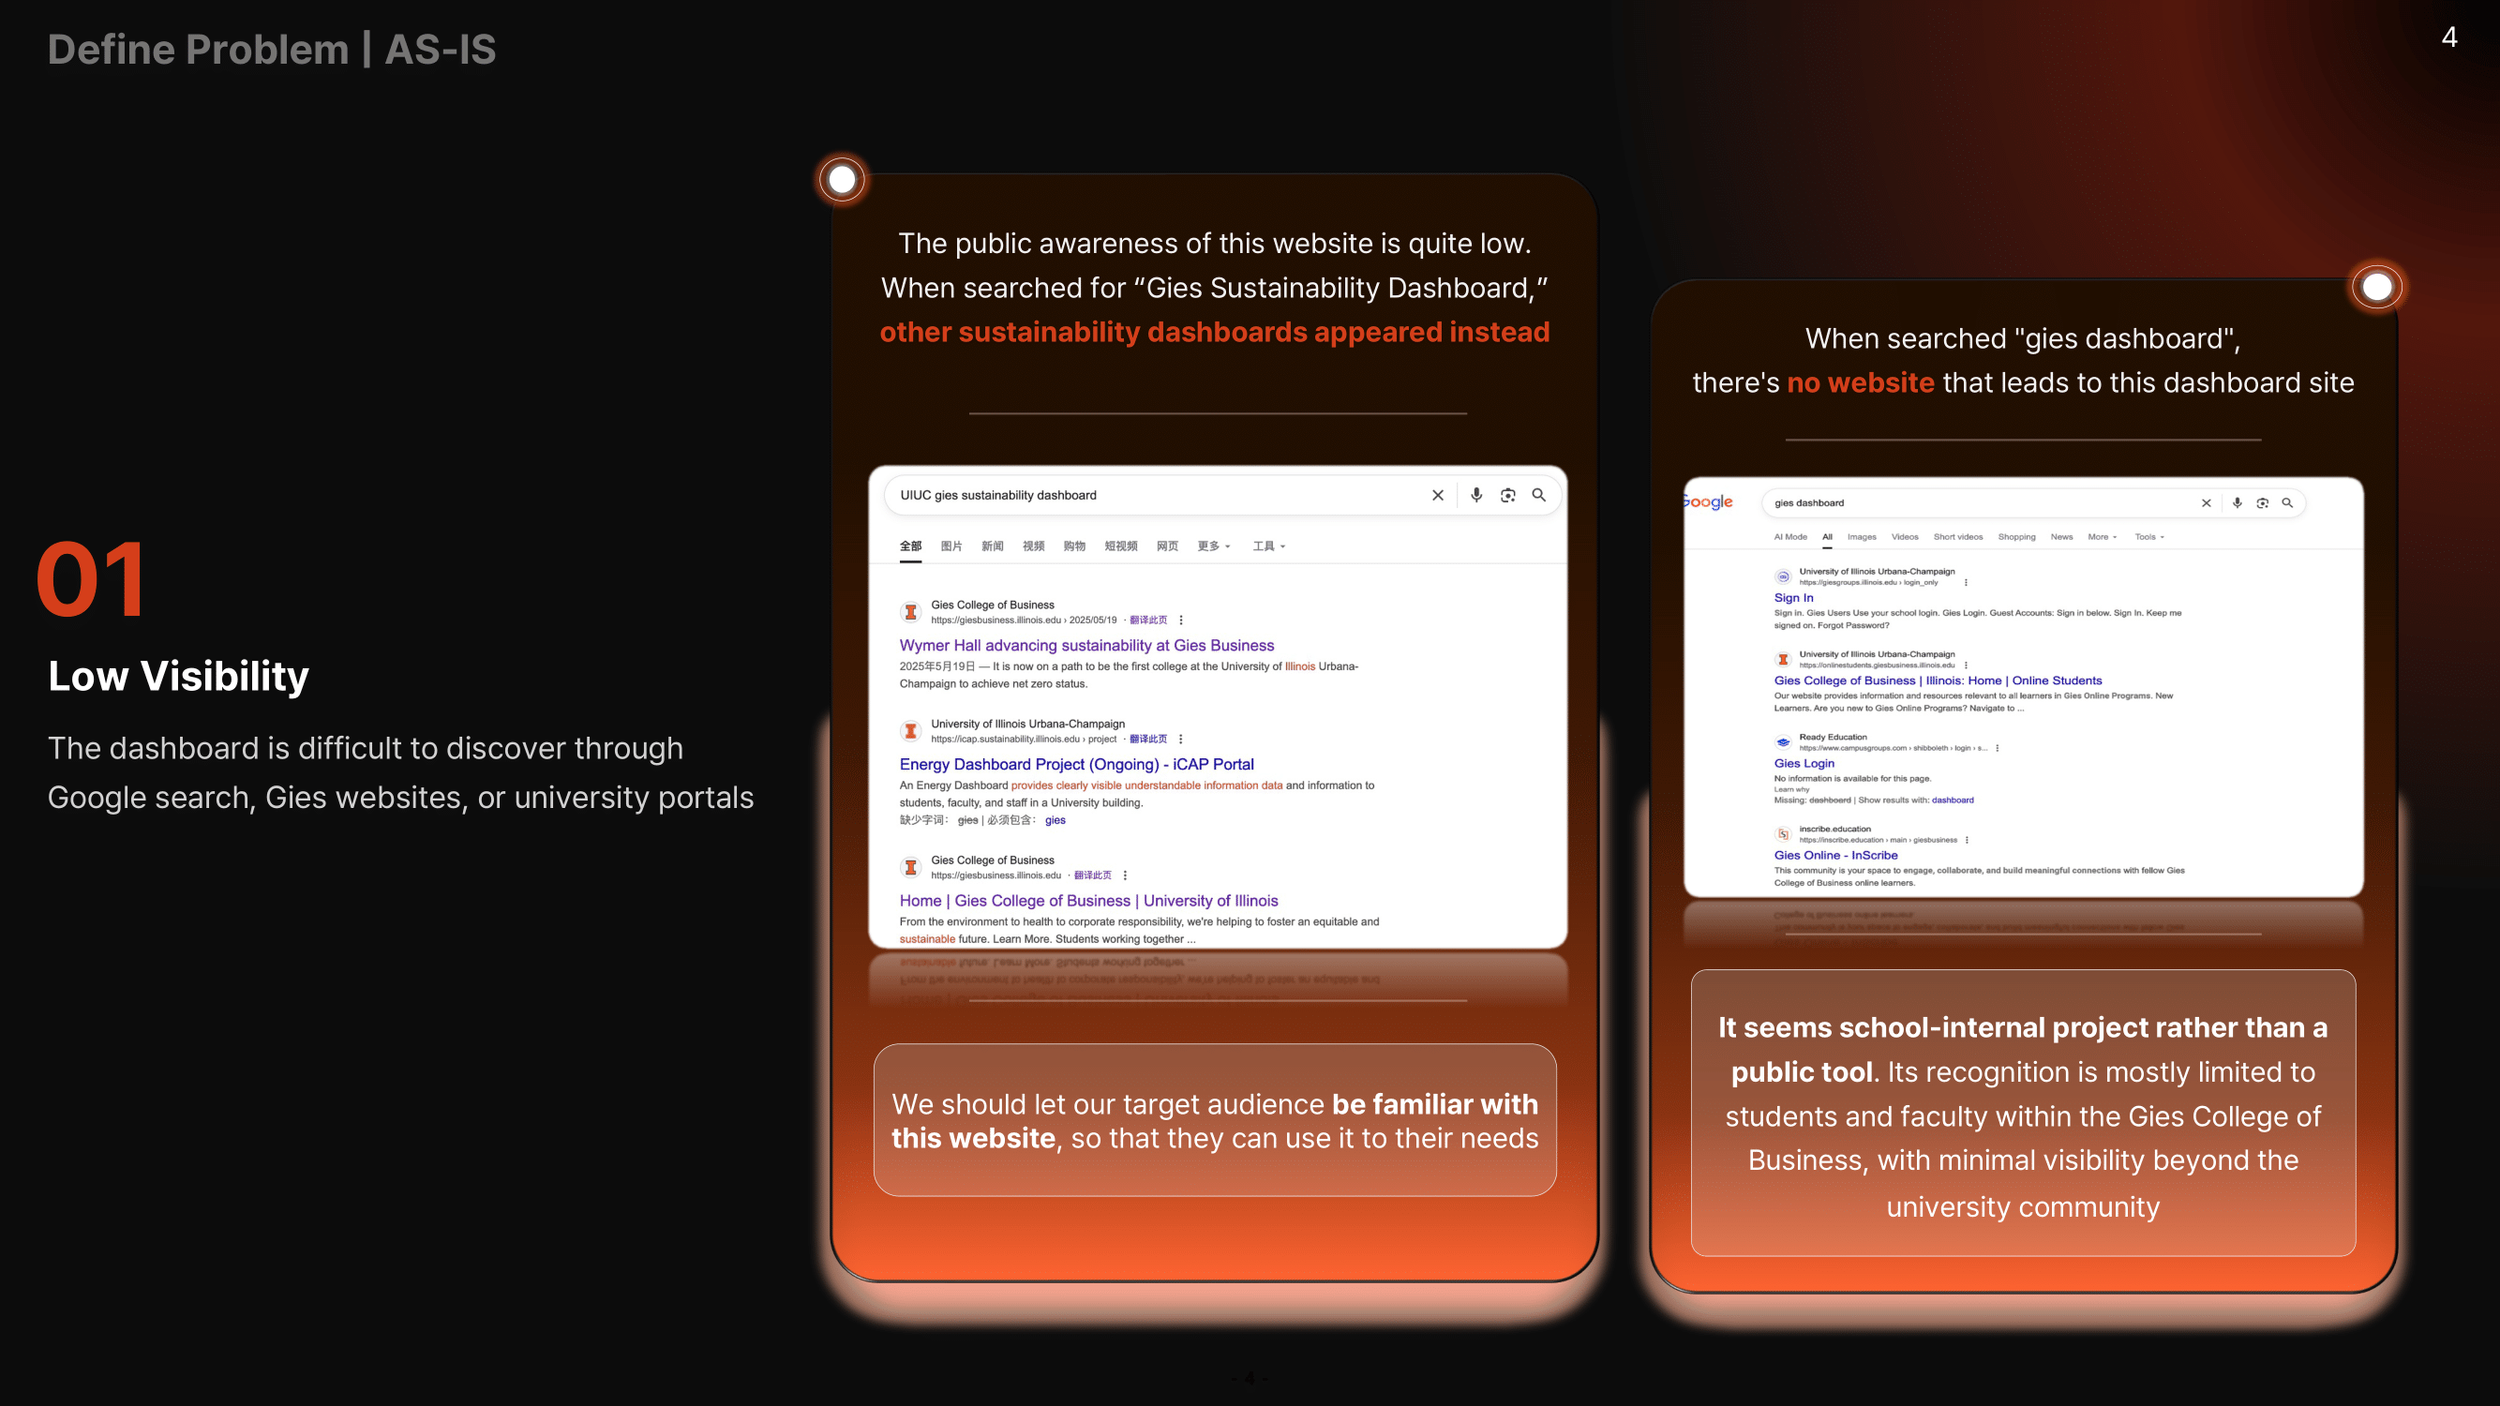
Low Visibility
• Not discoverable via Google
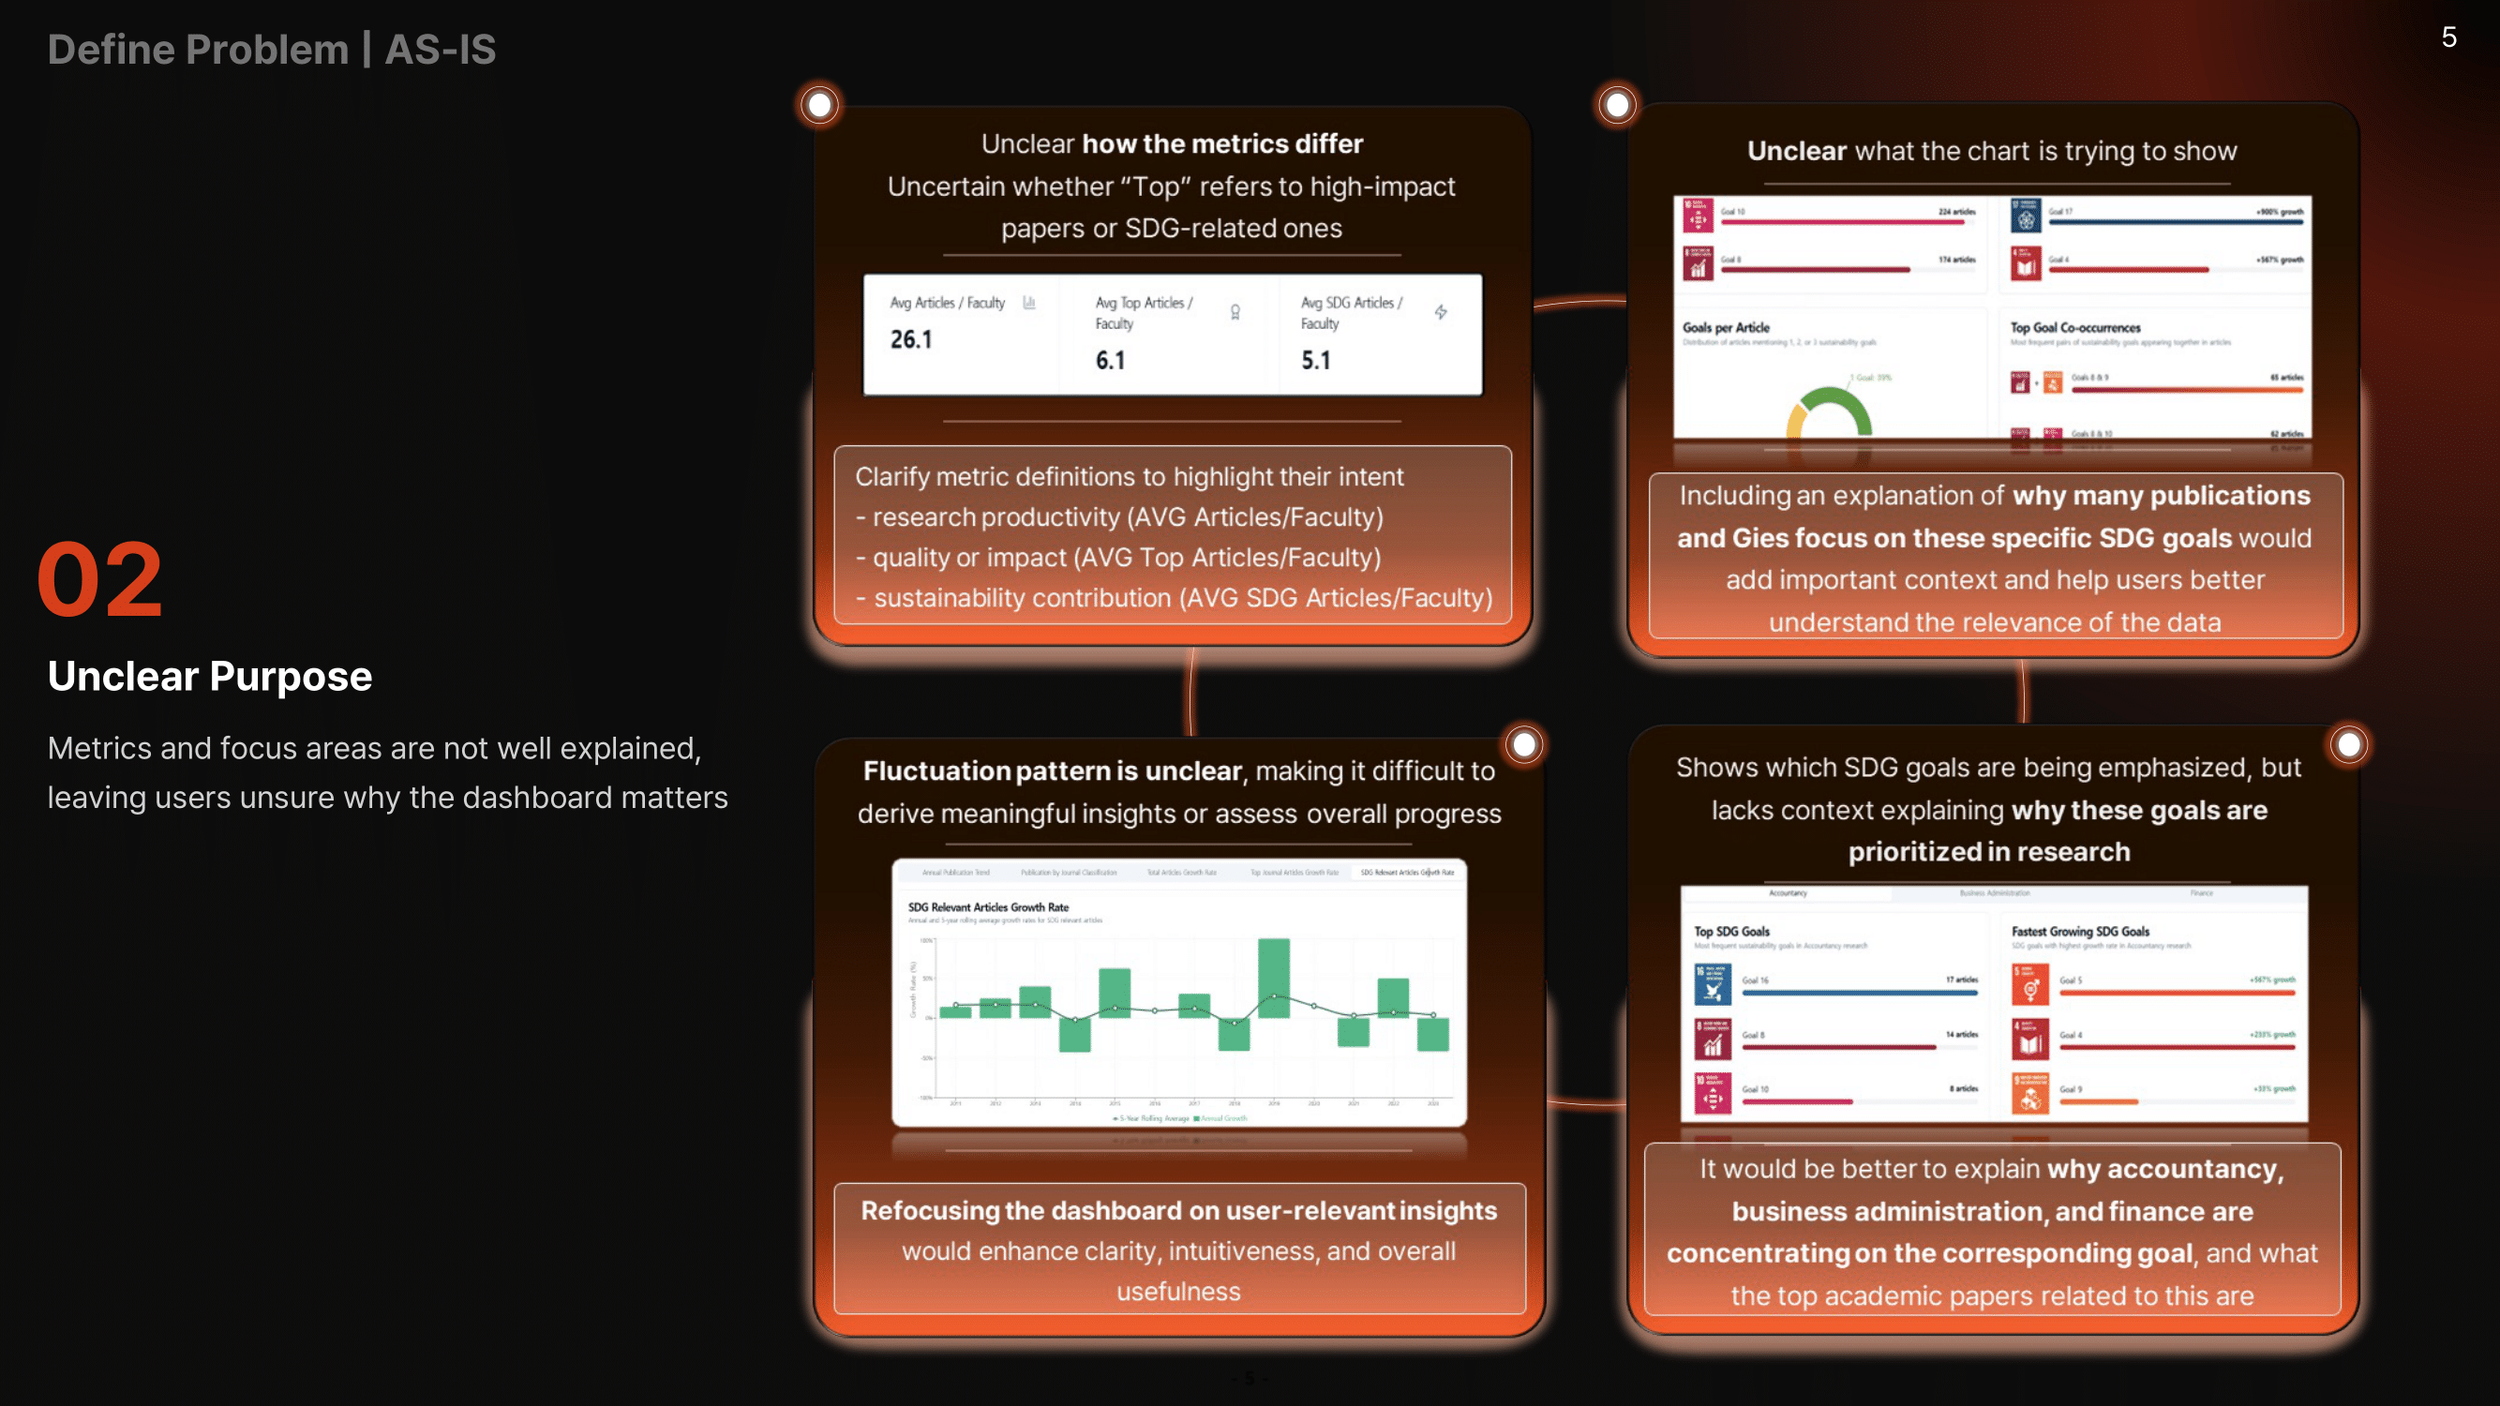
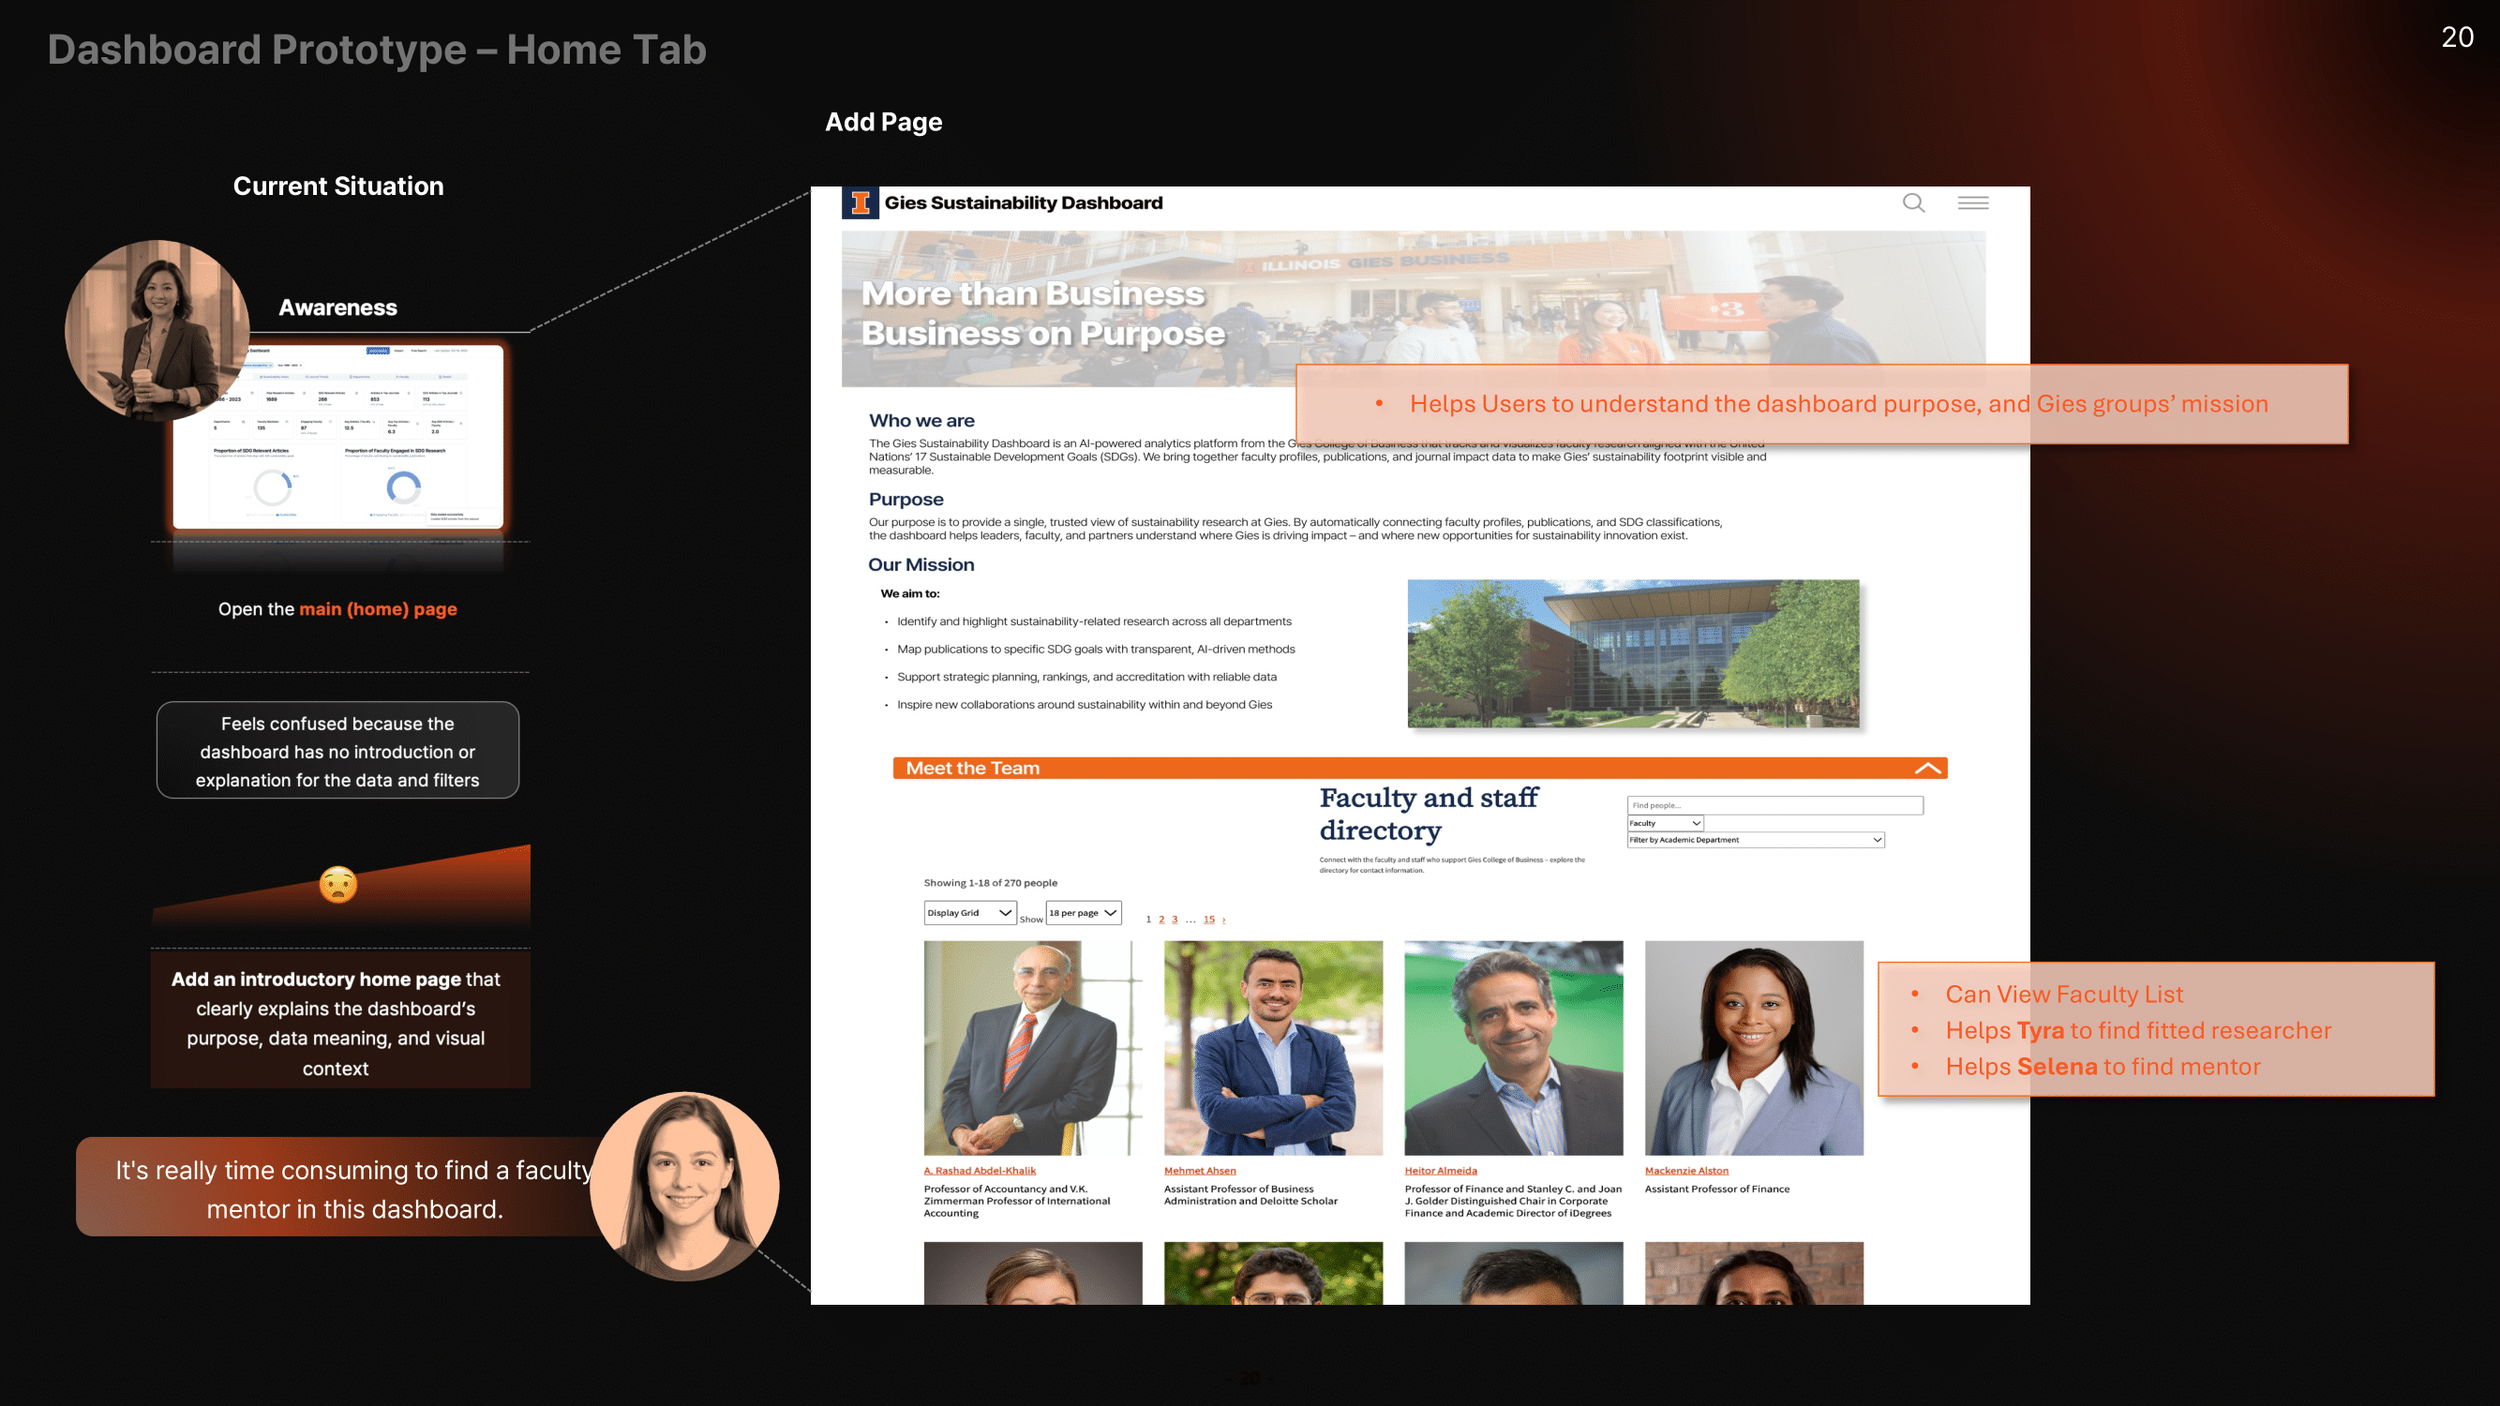
• Poor integration into the university ecosystemUnclear Purpose
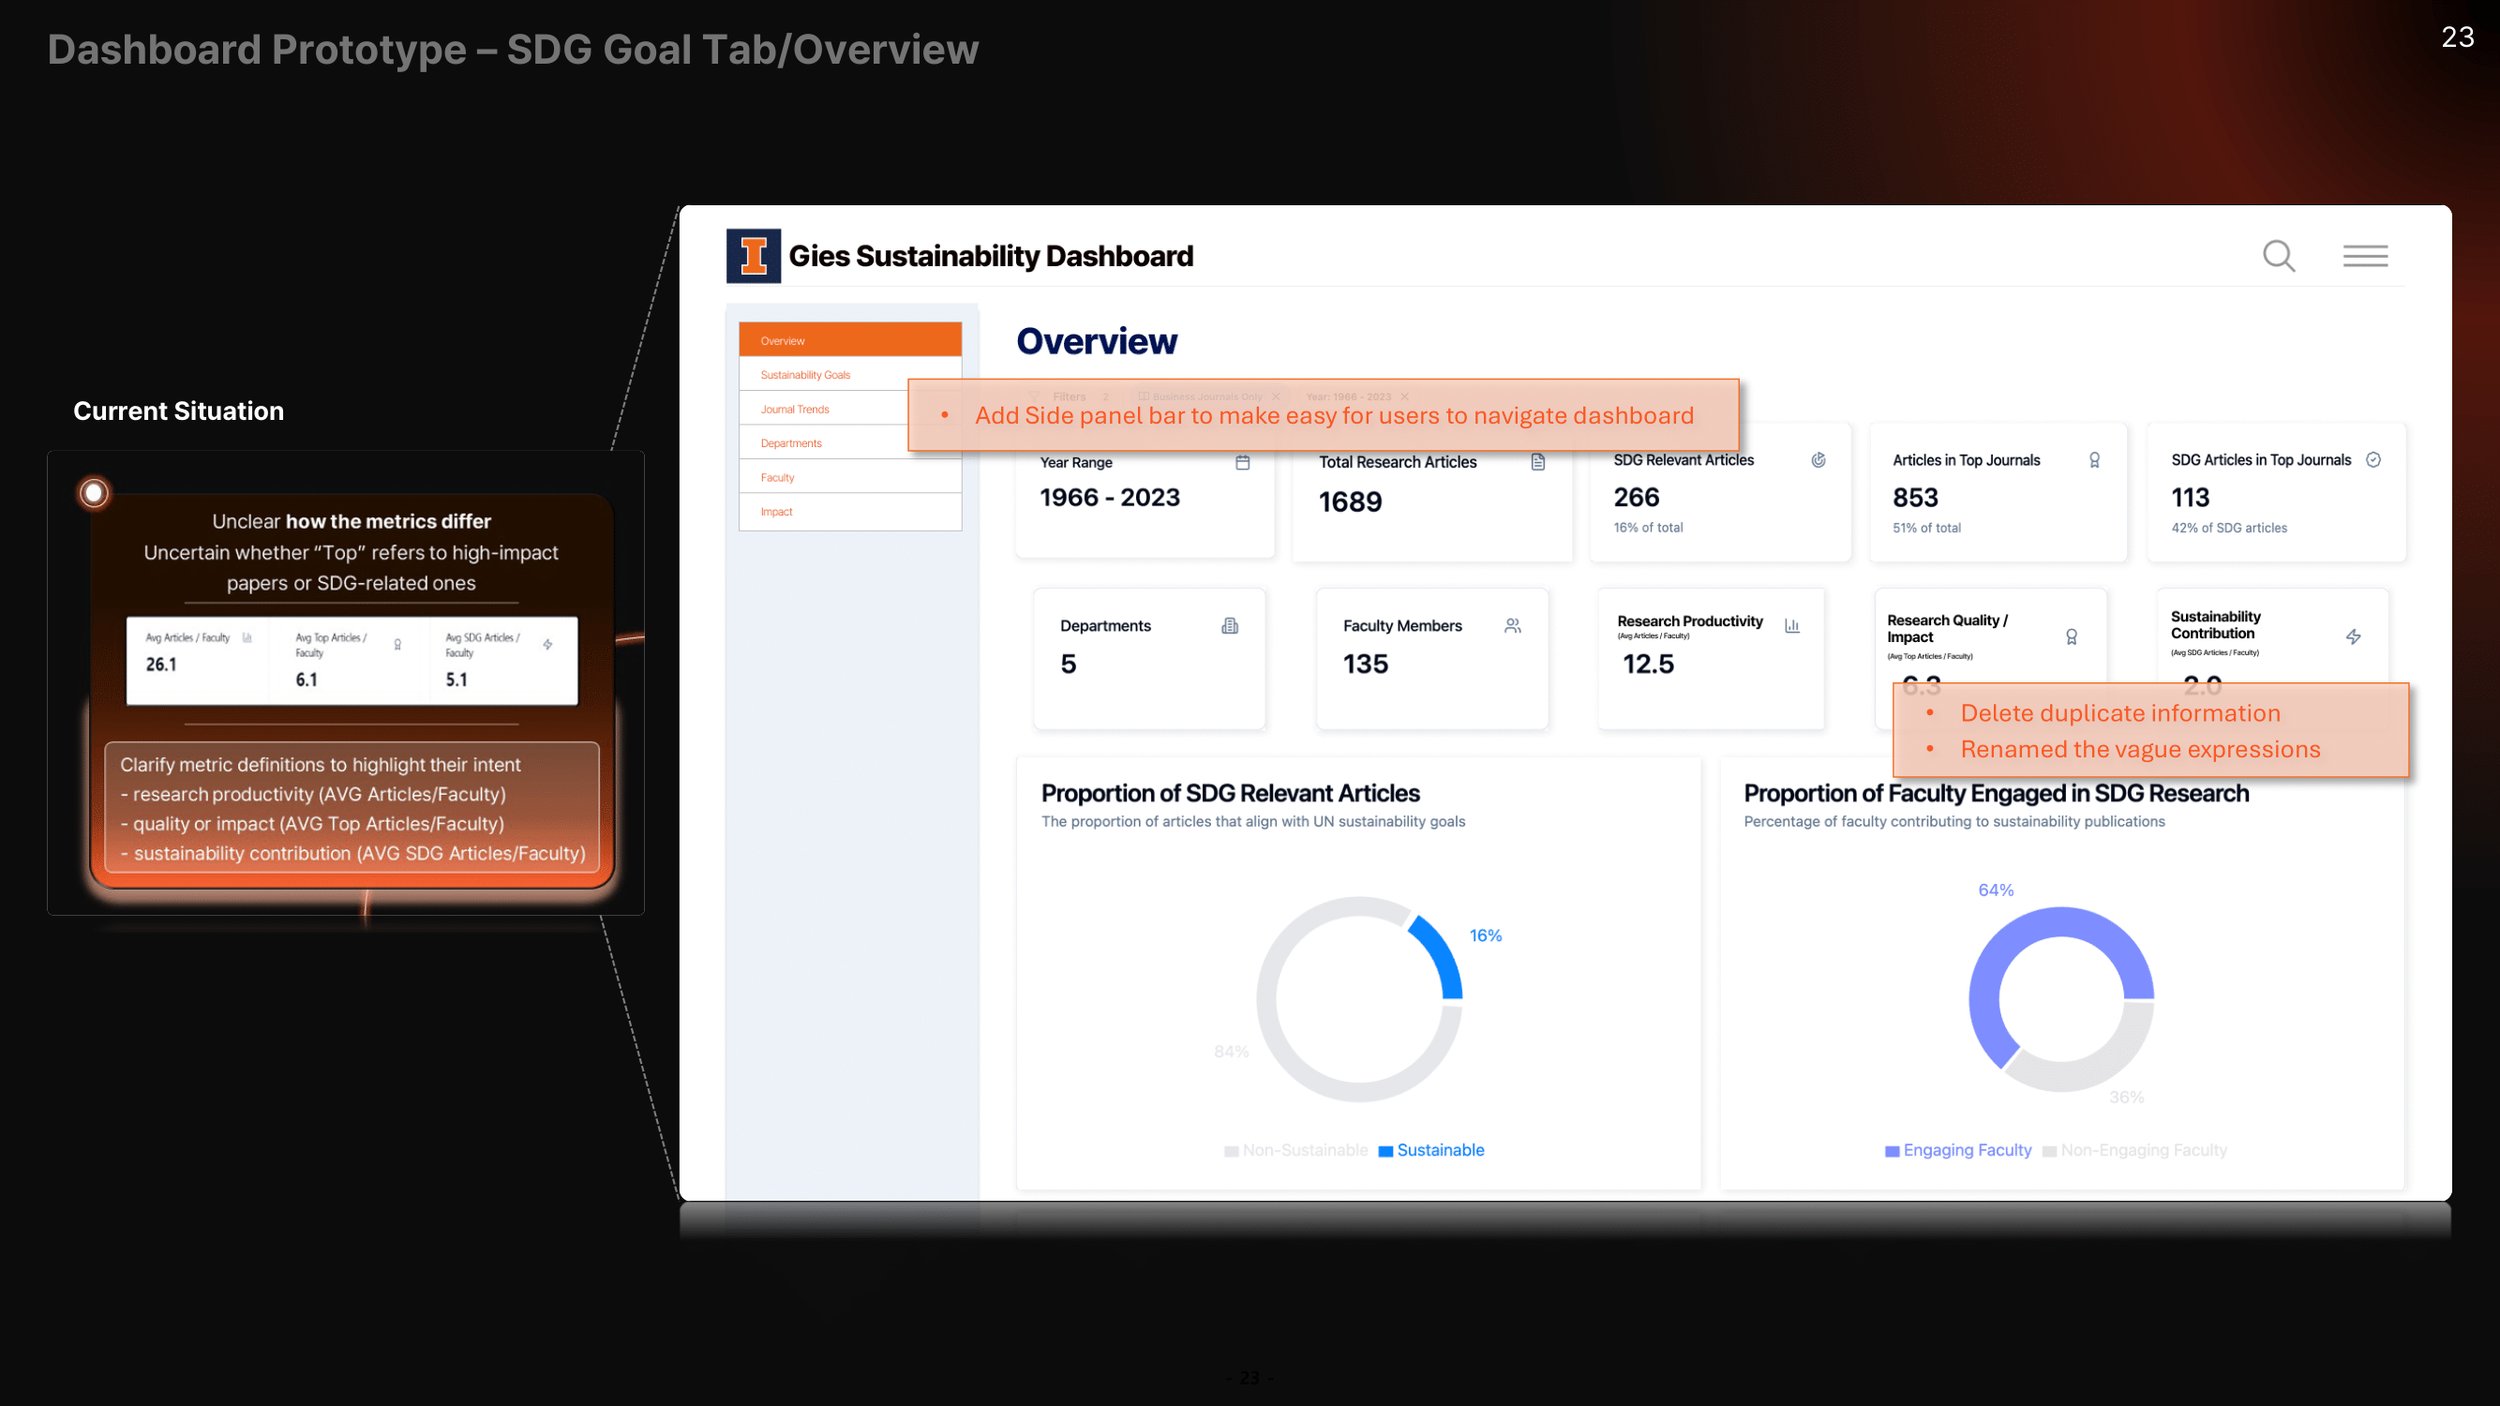
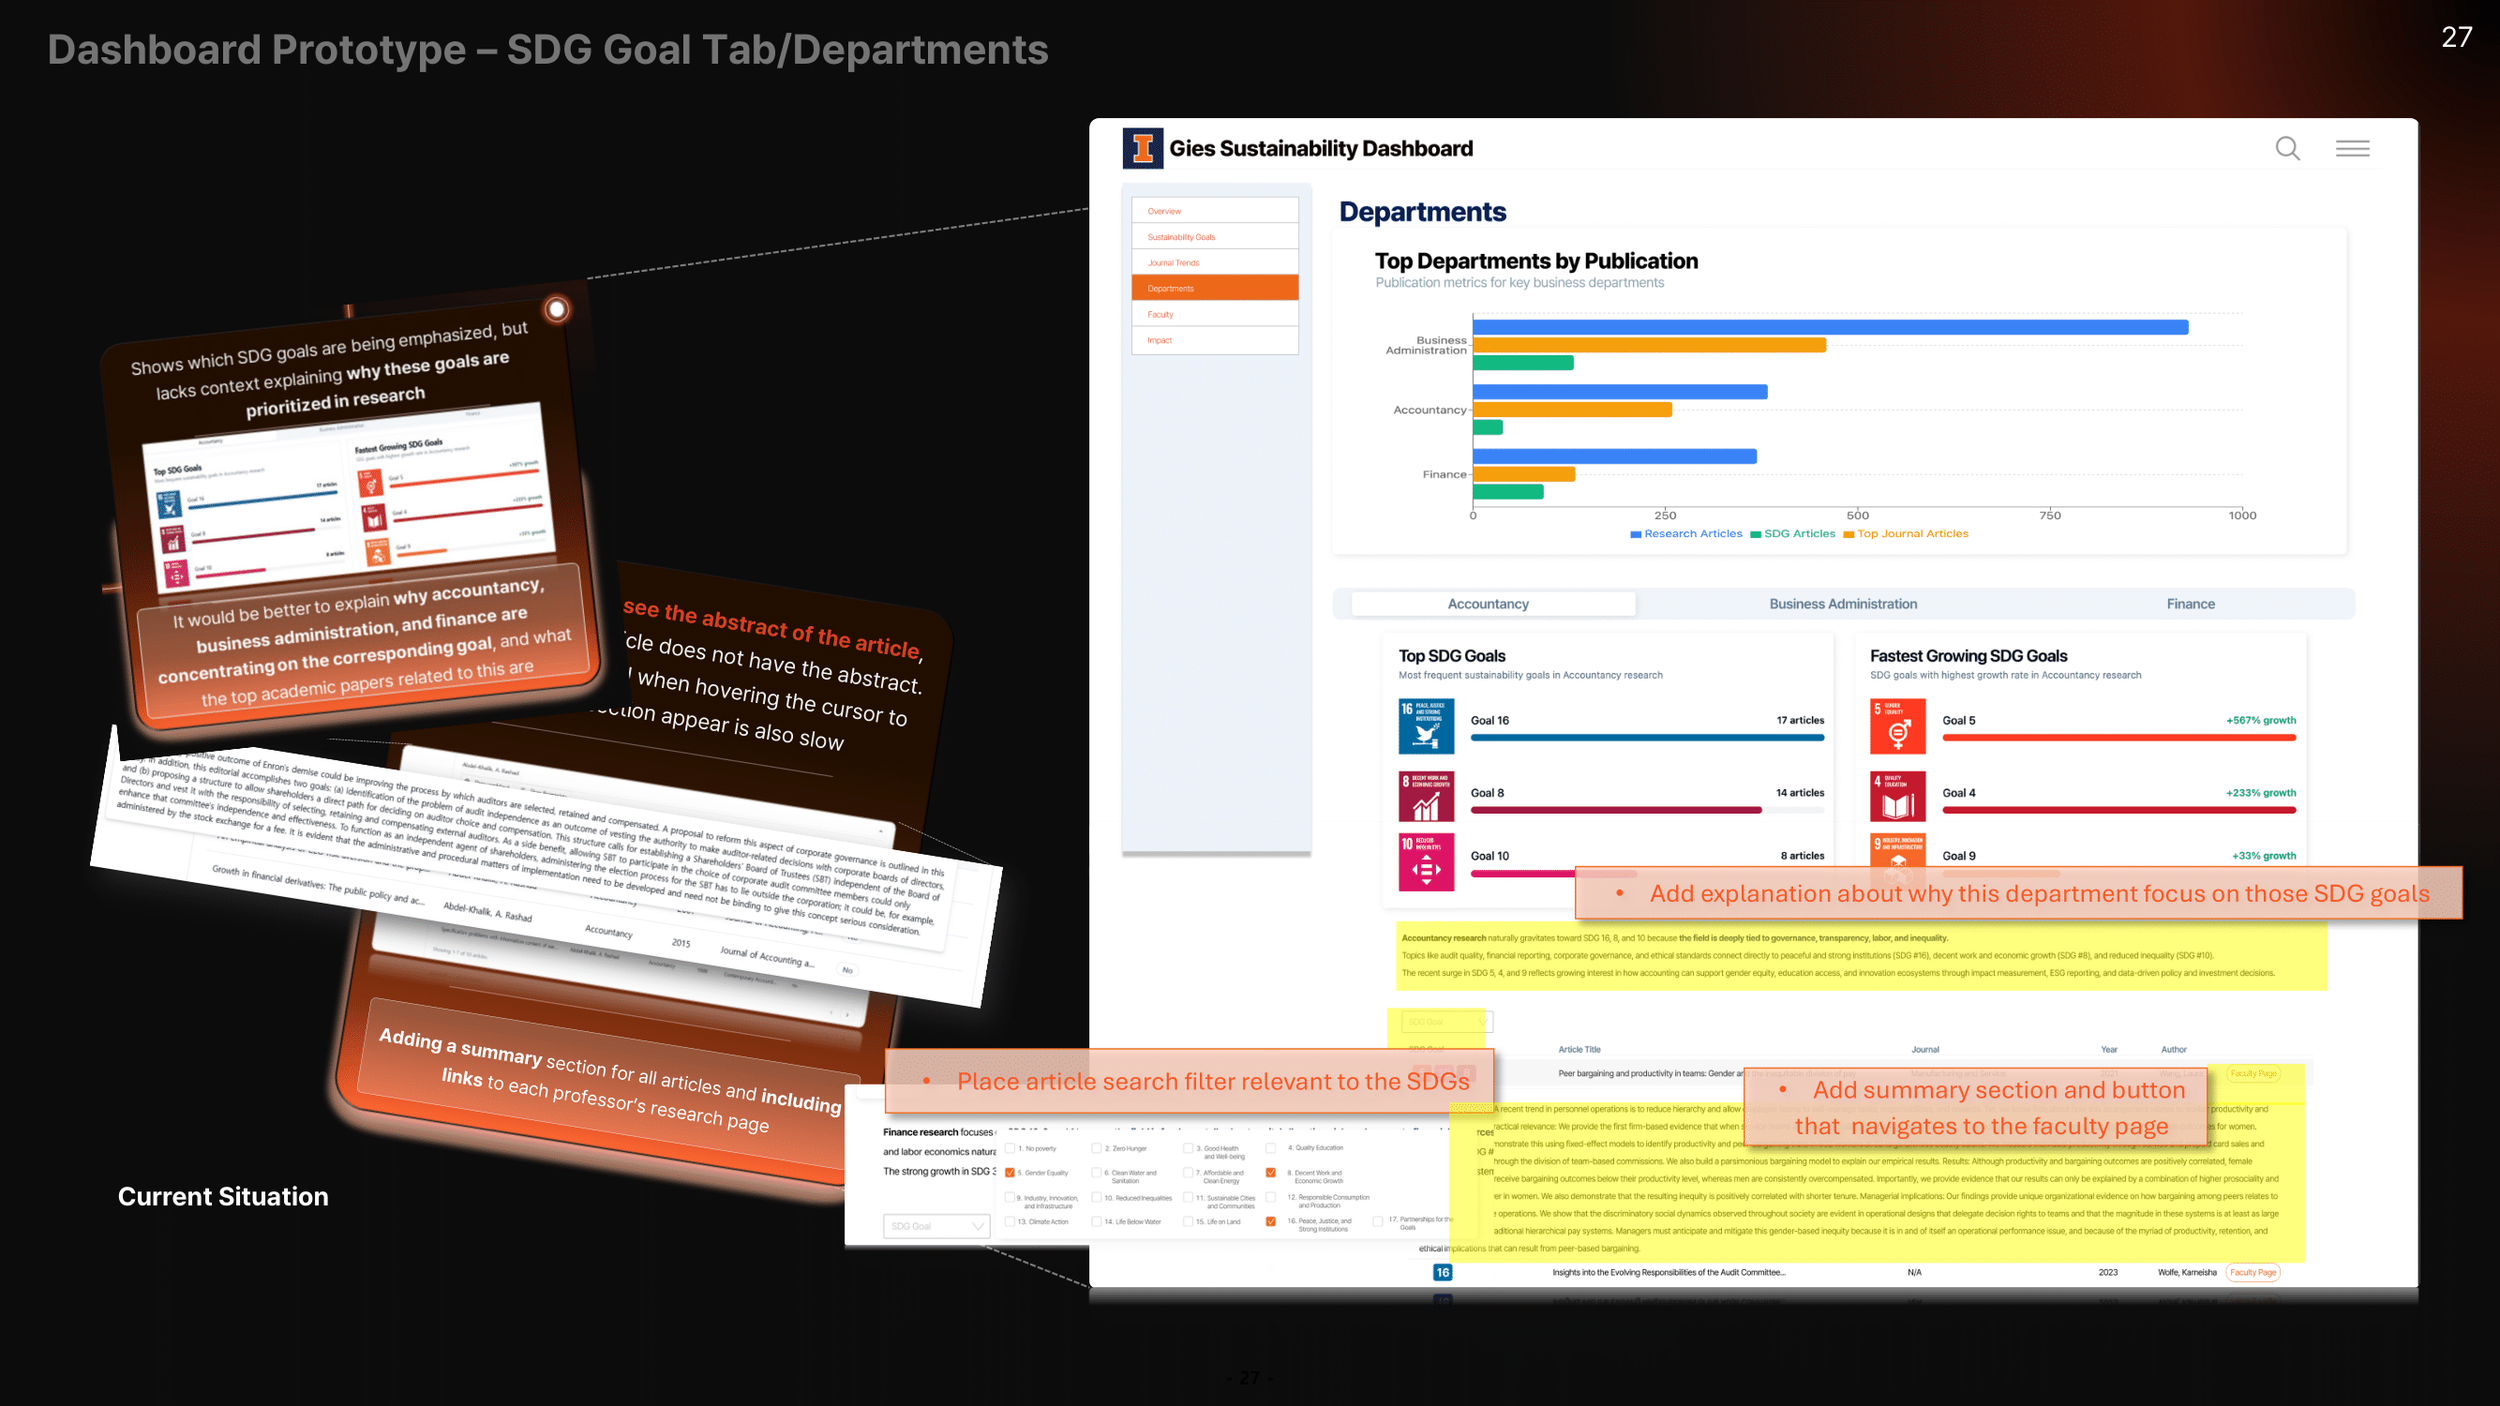
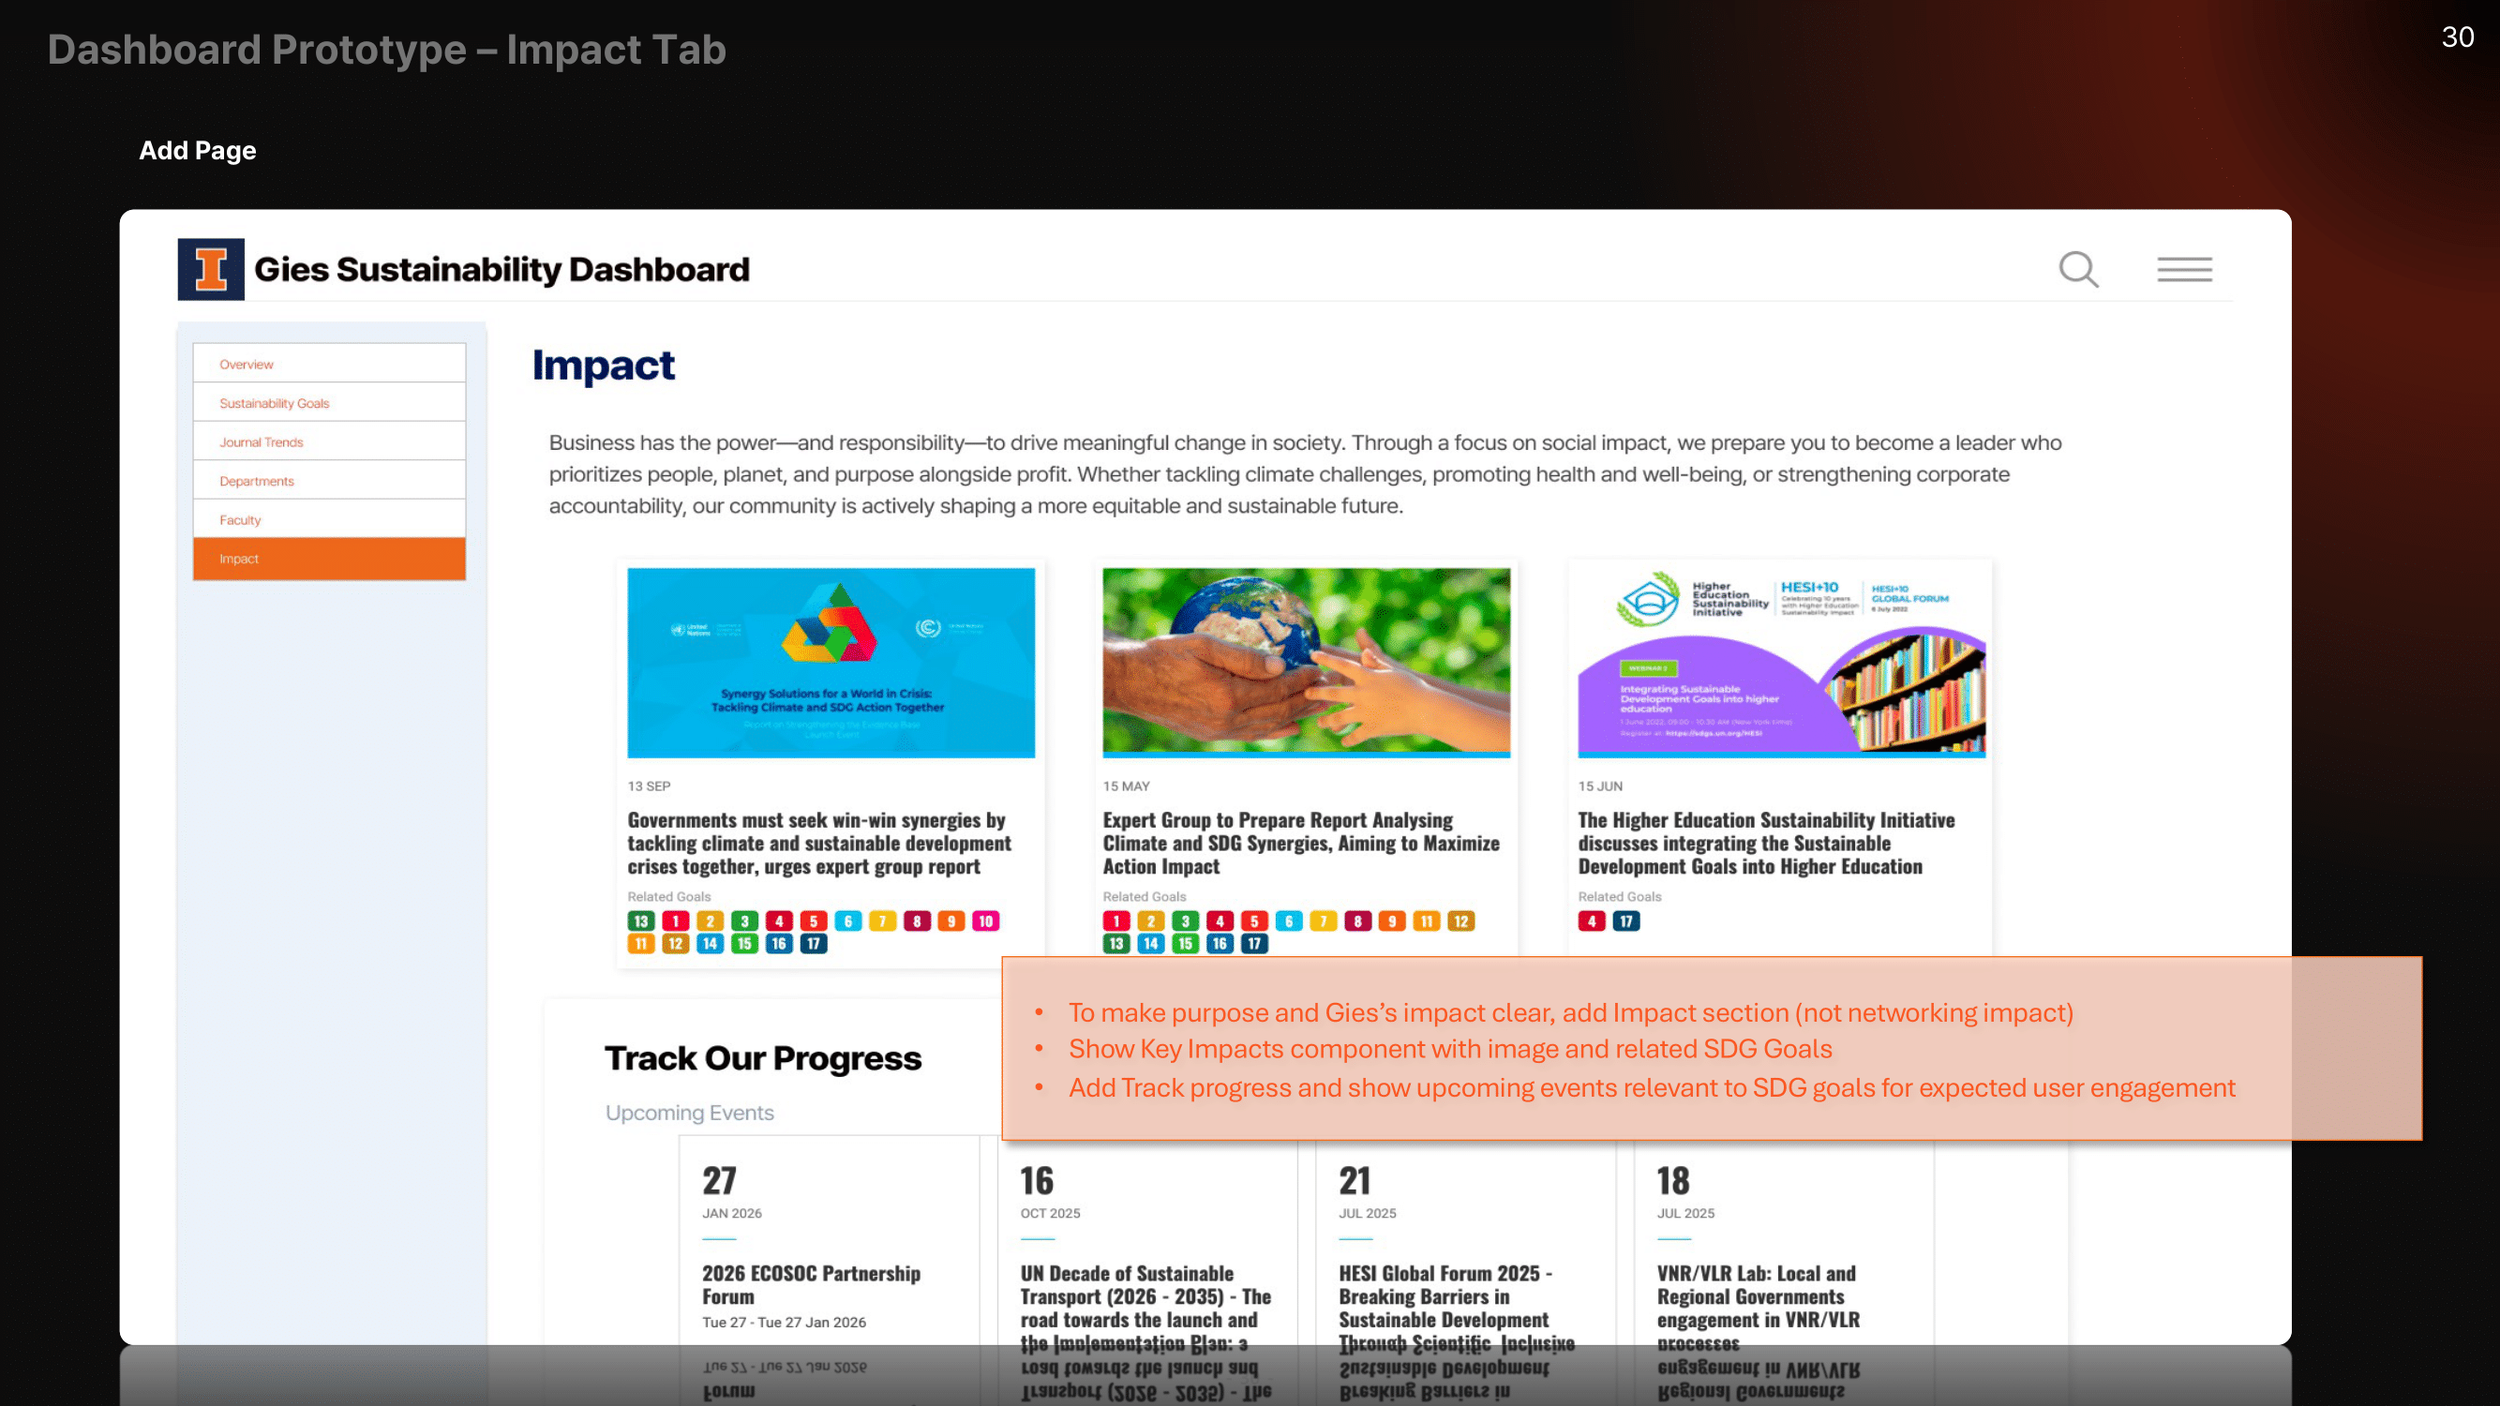
• Metrics lacked explanation
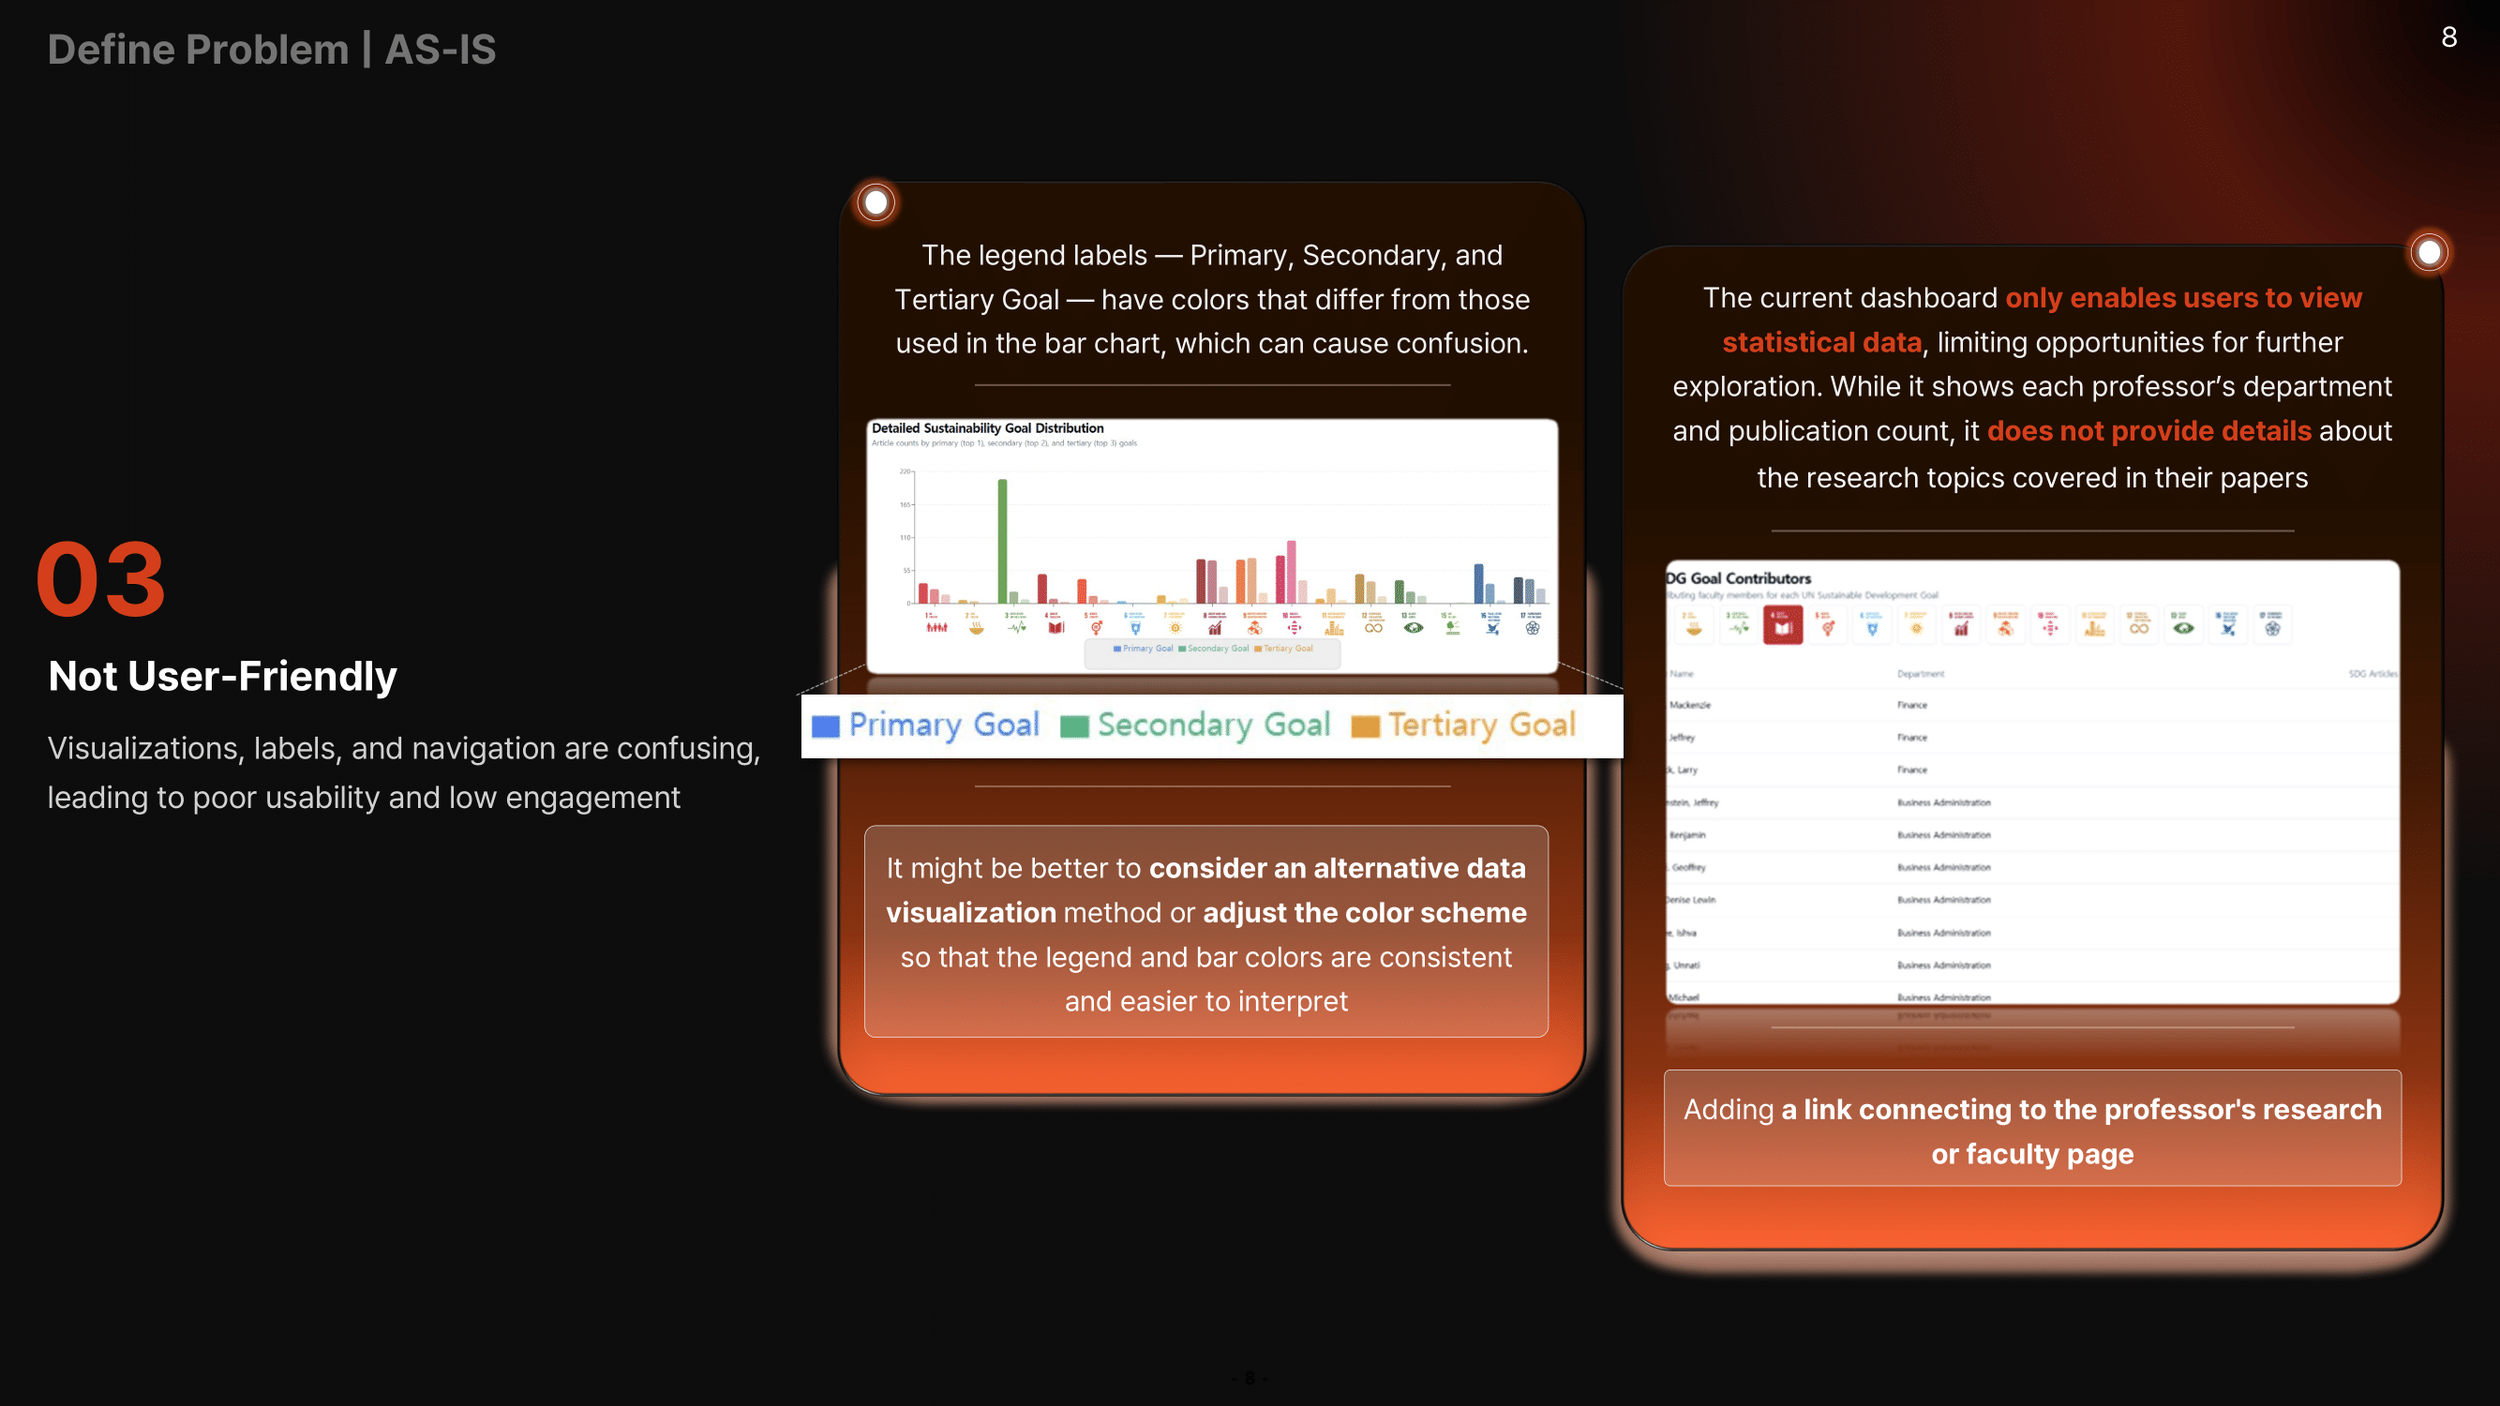
• SDG classifications lacked contextual meaningPoor User Experience
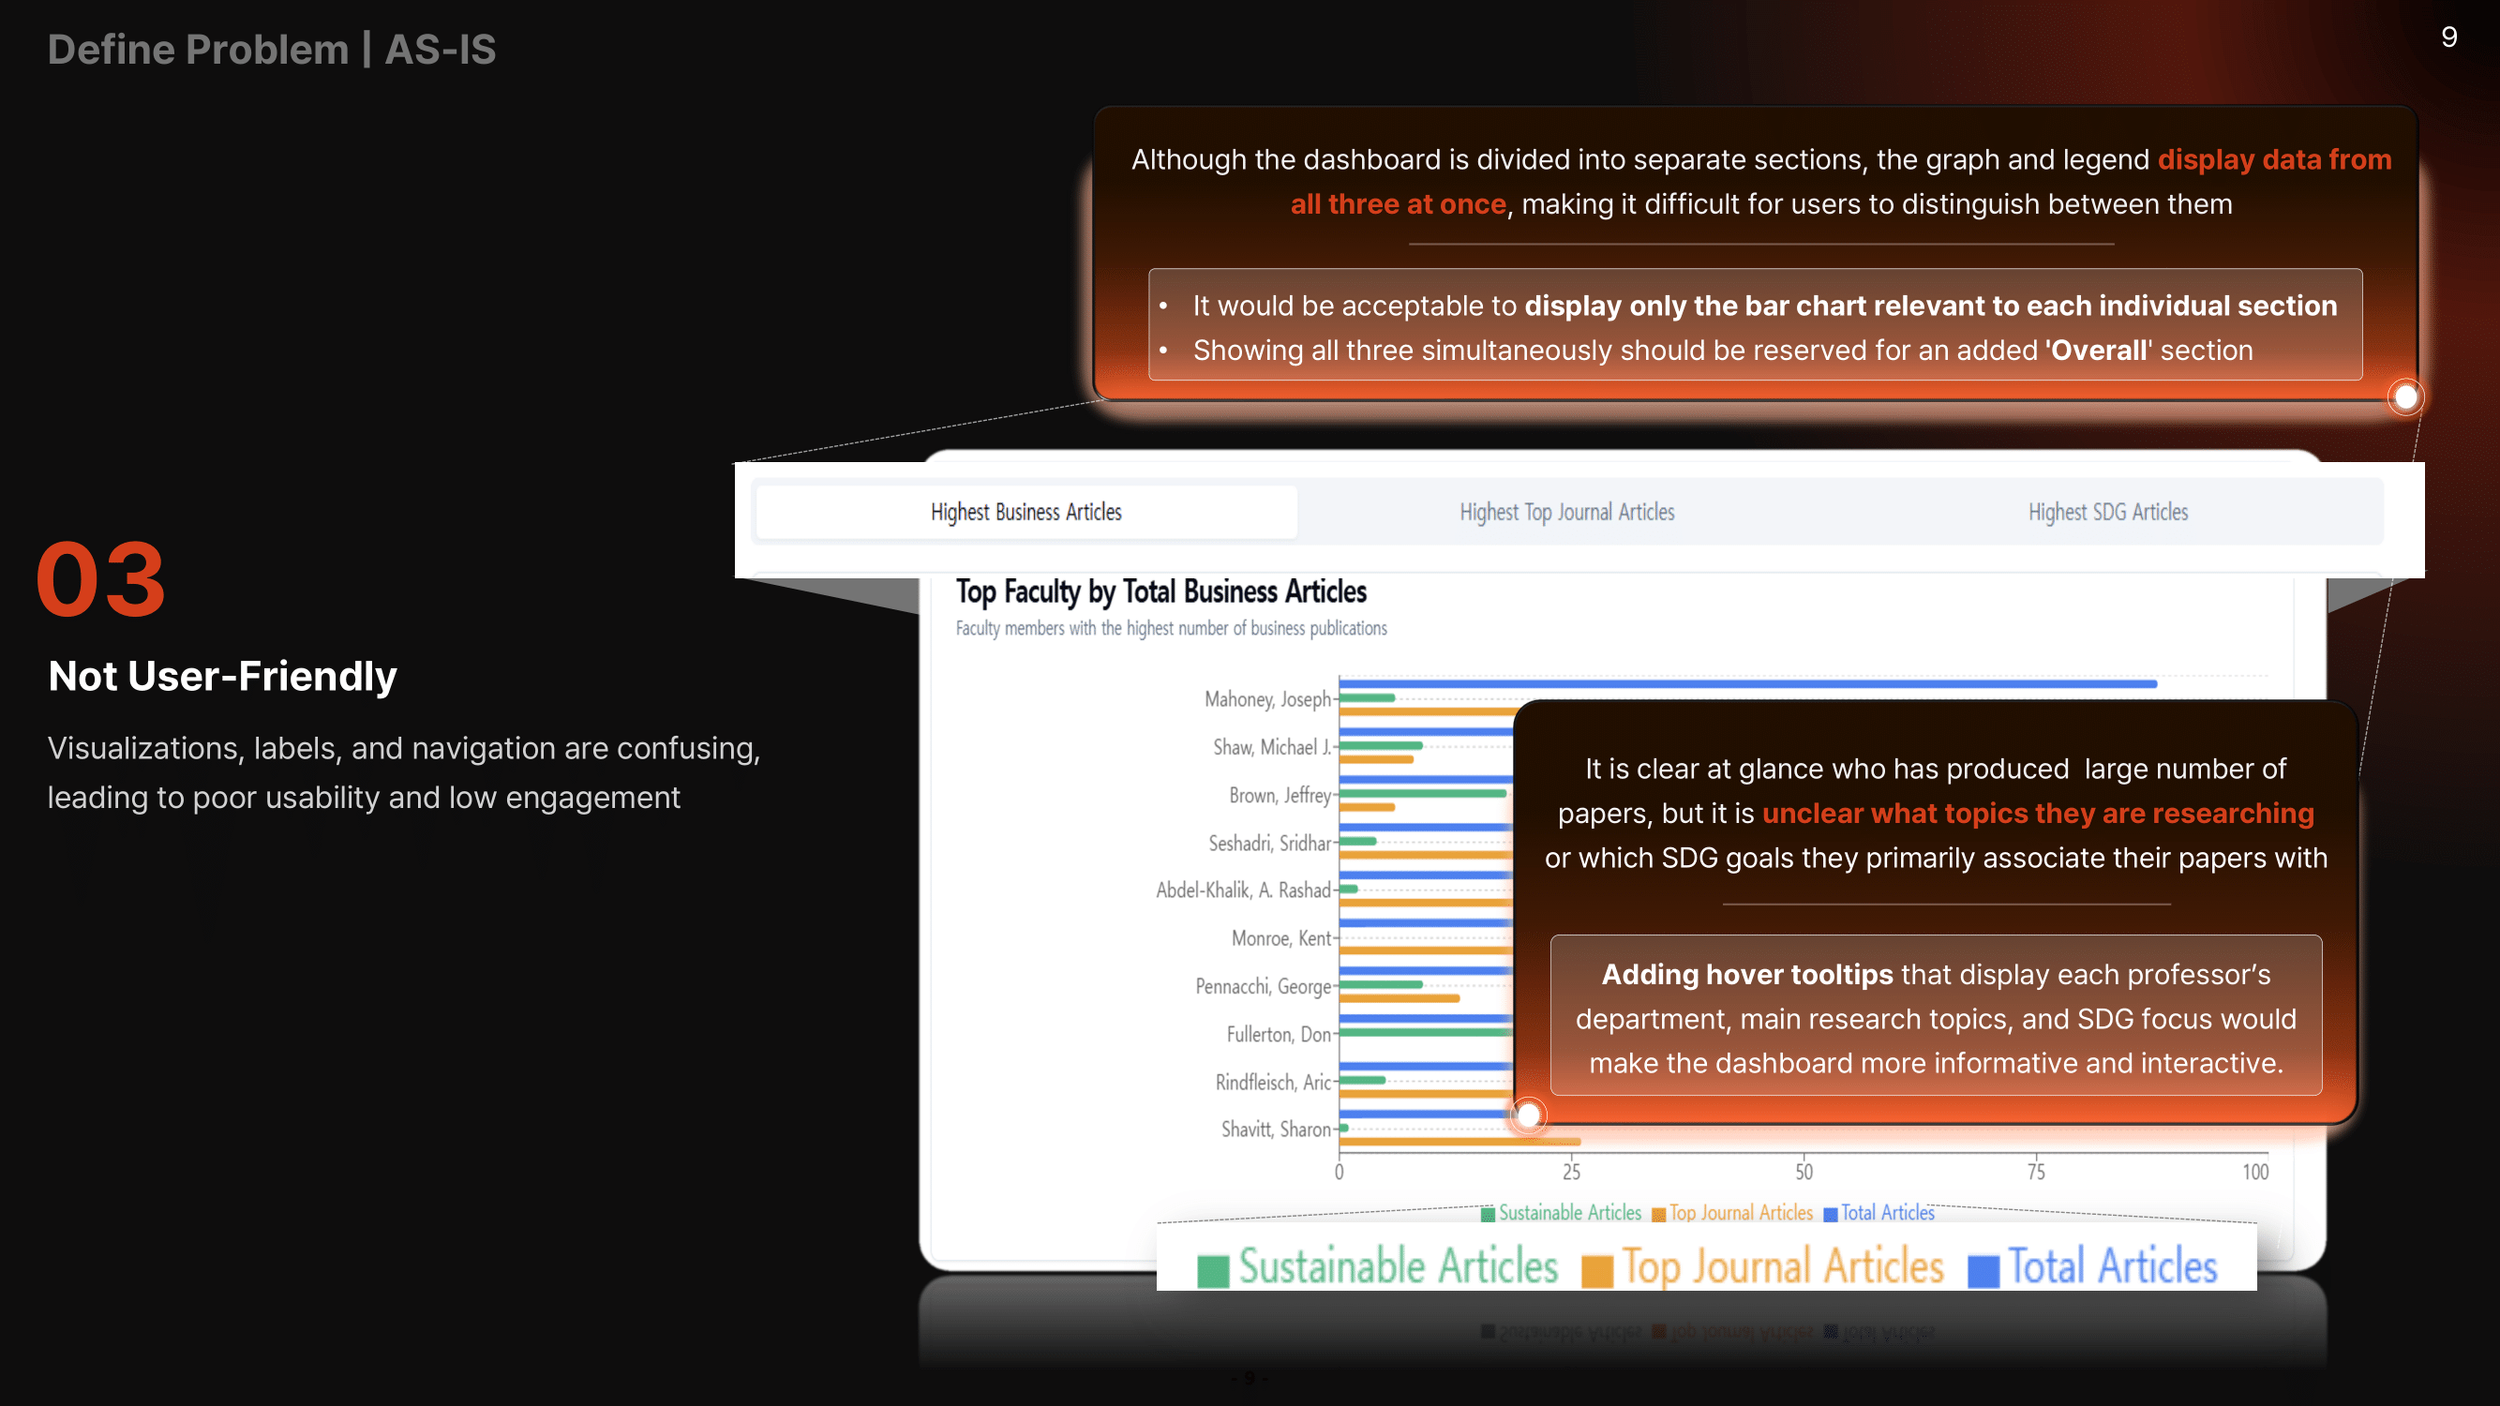
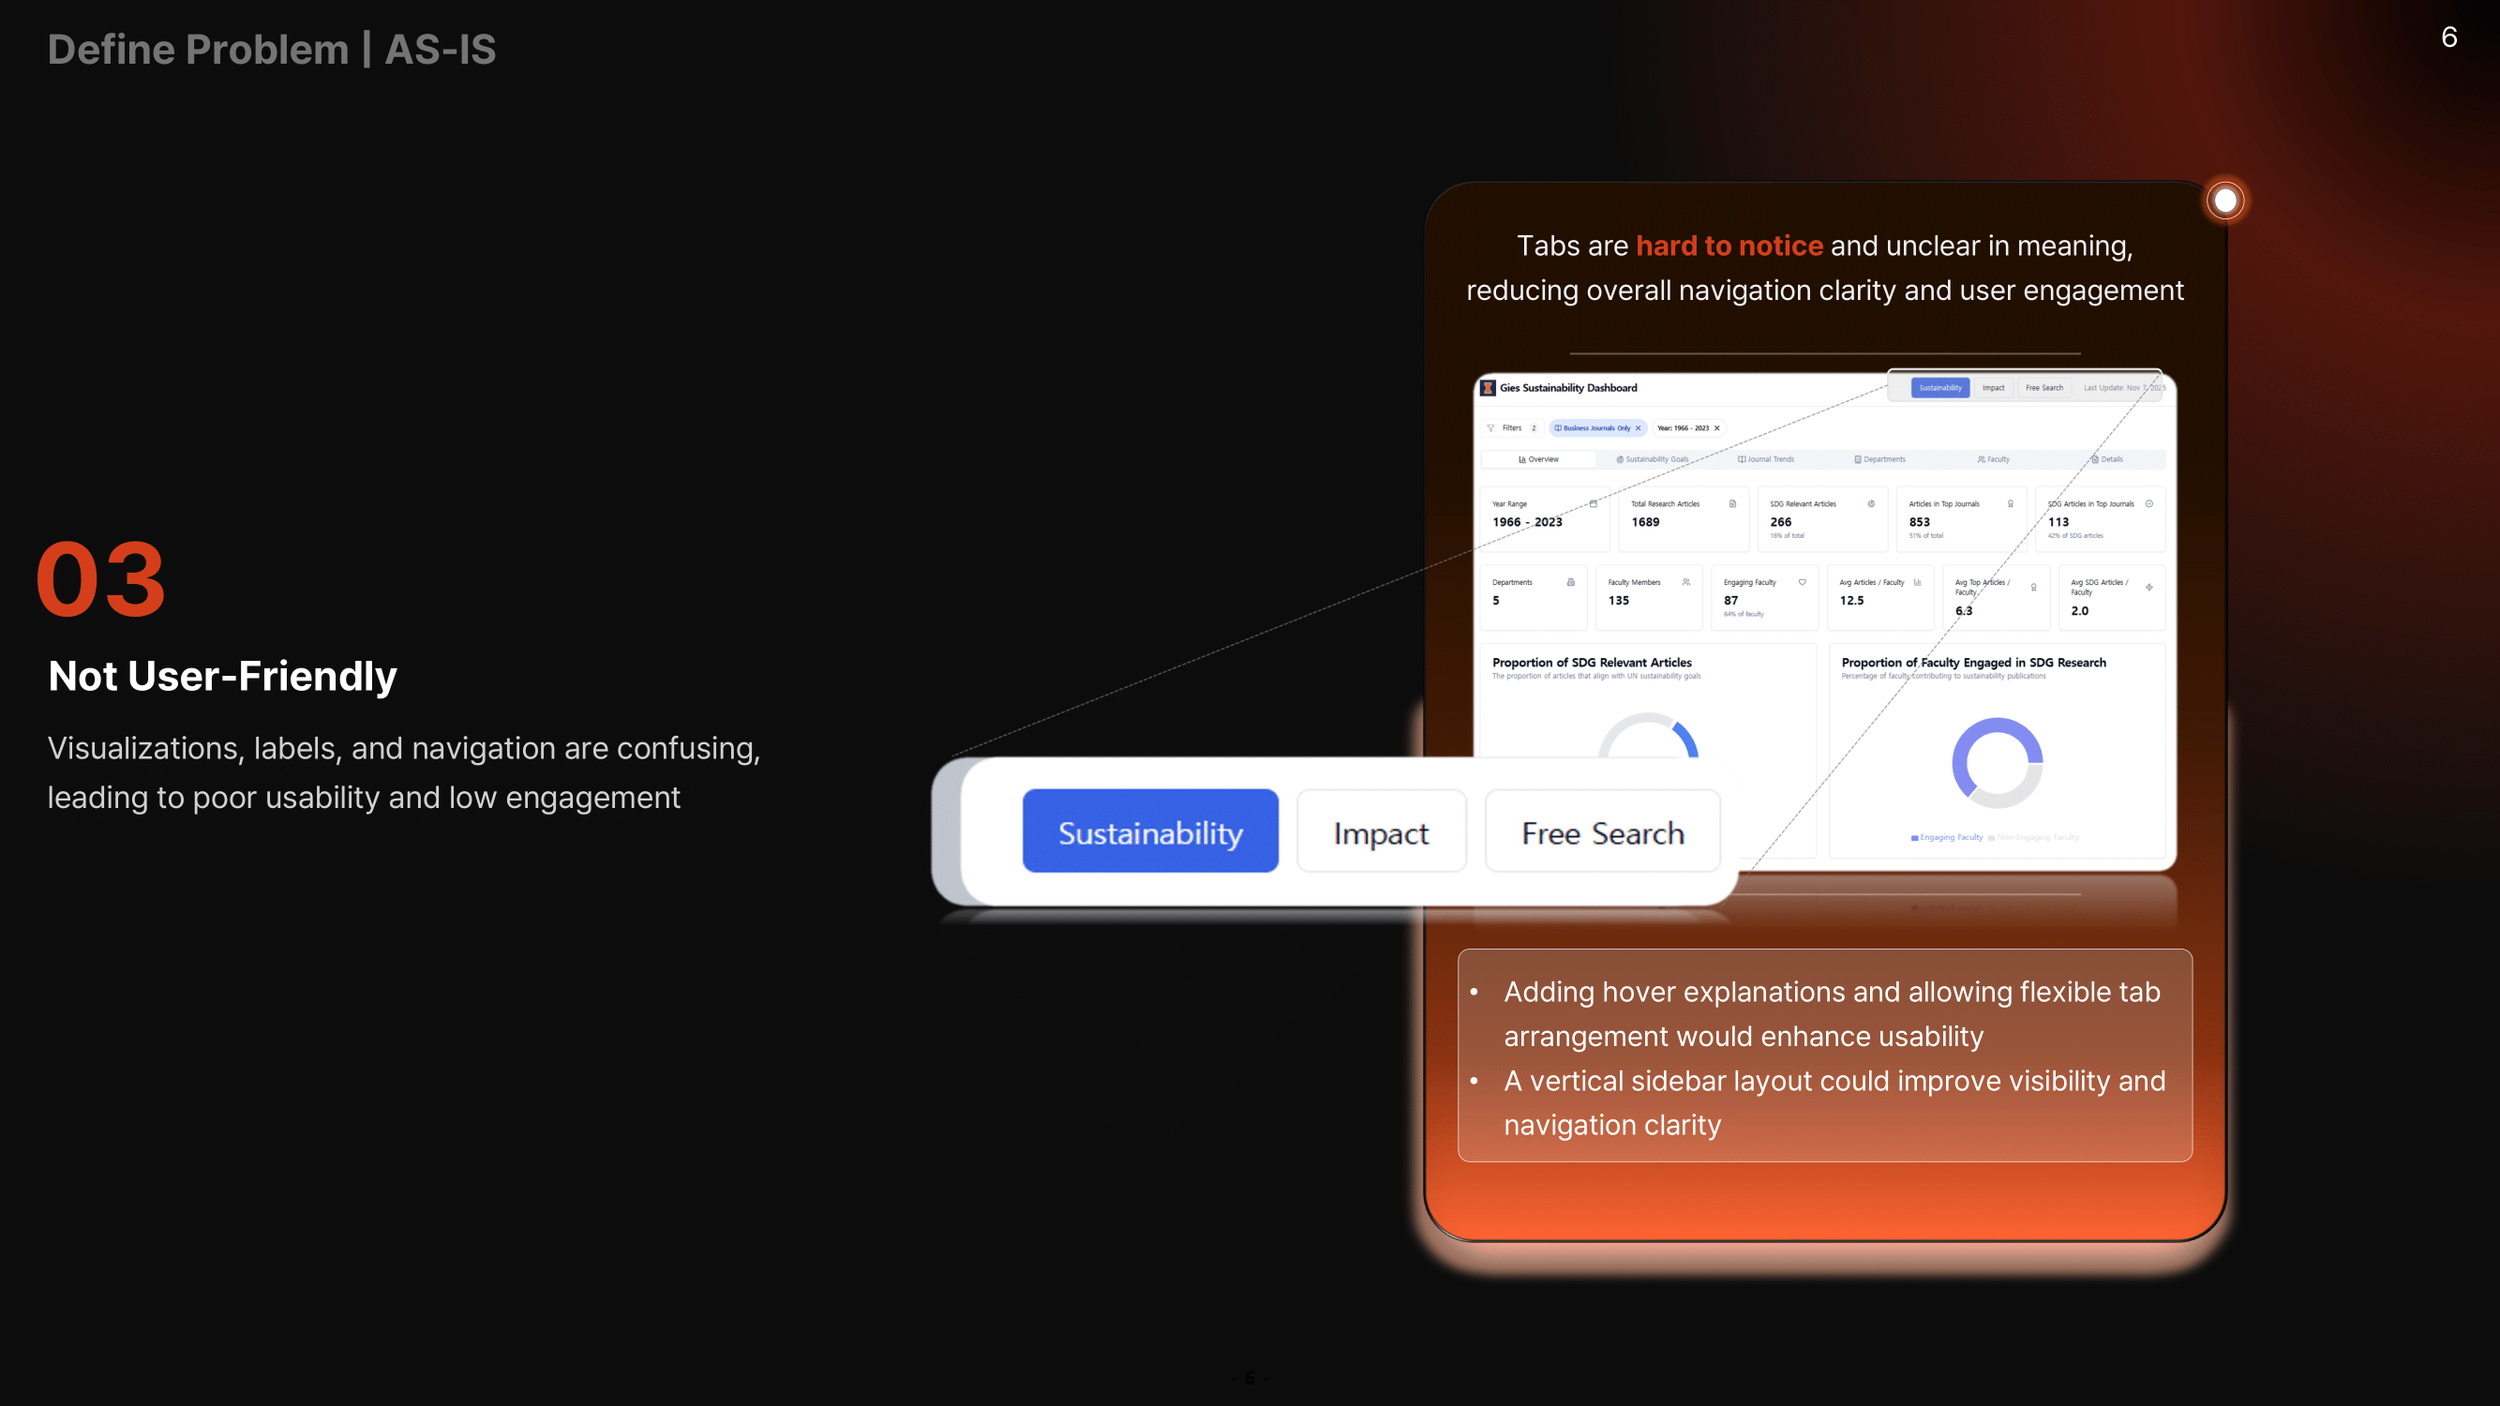
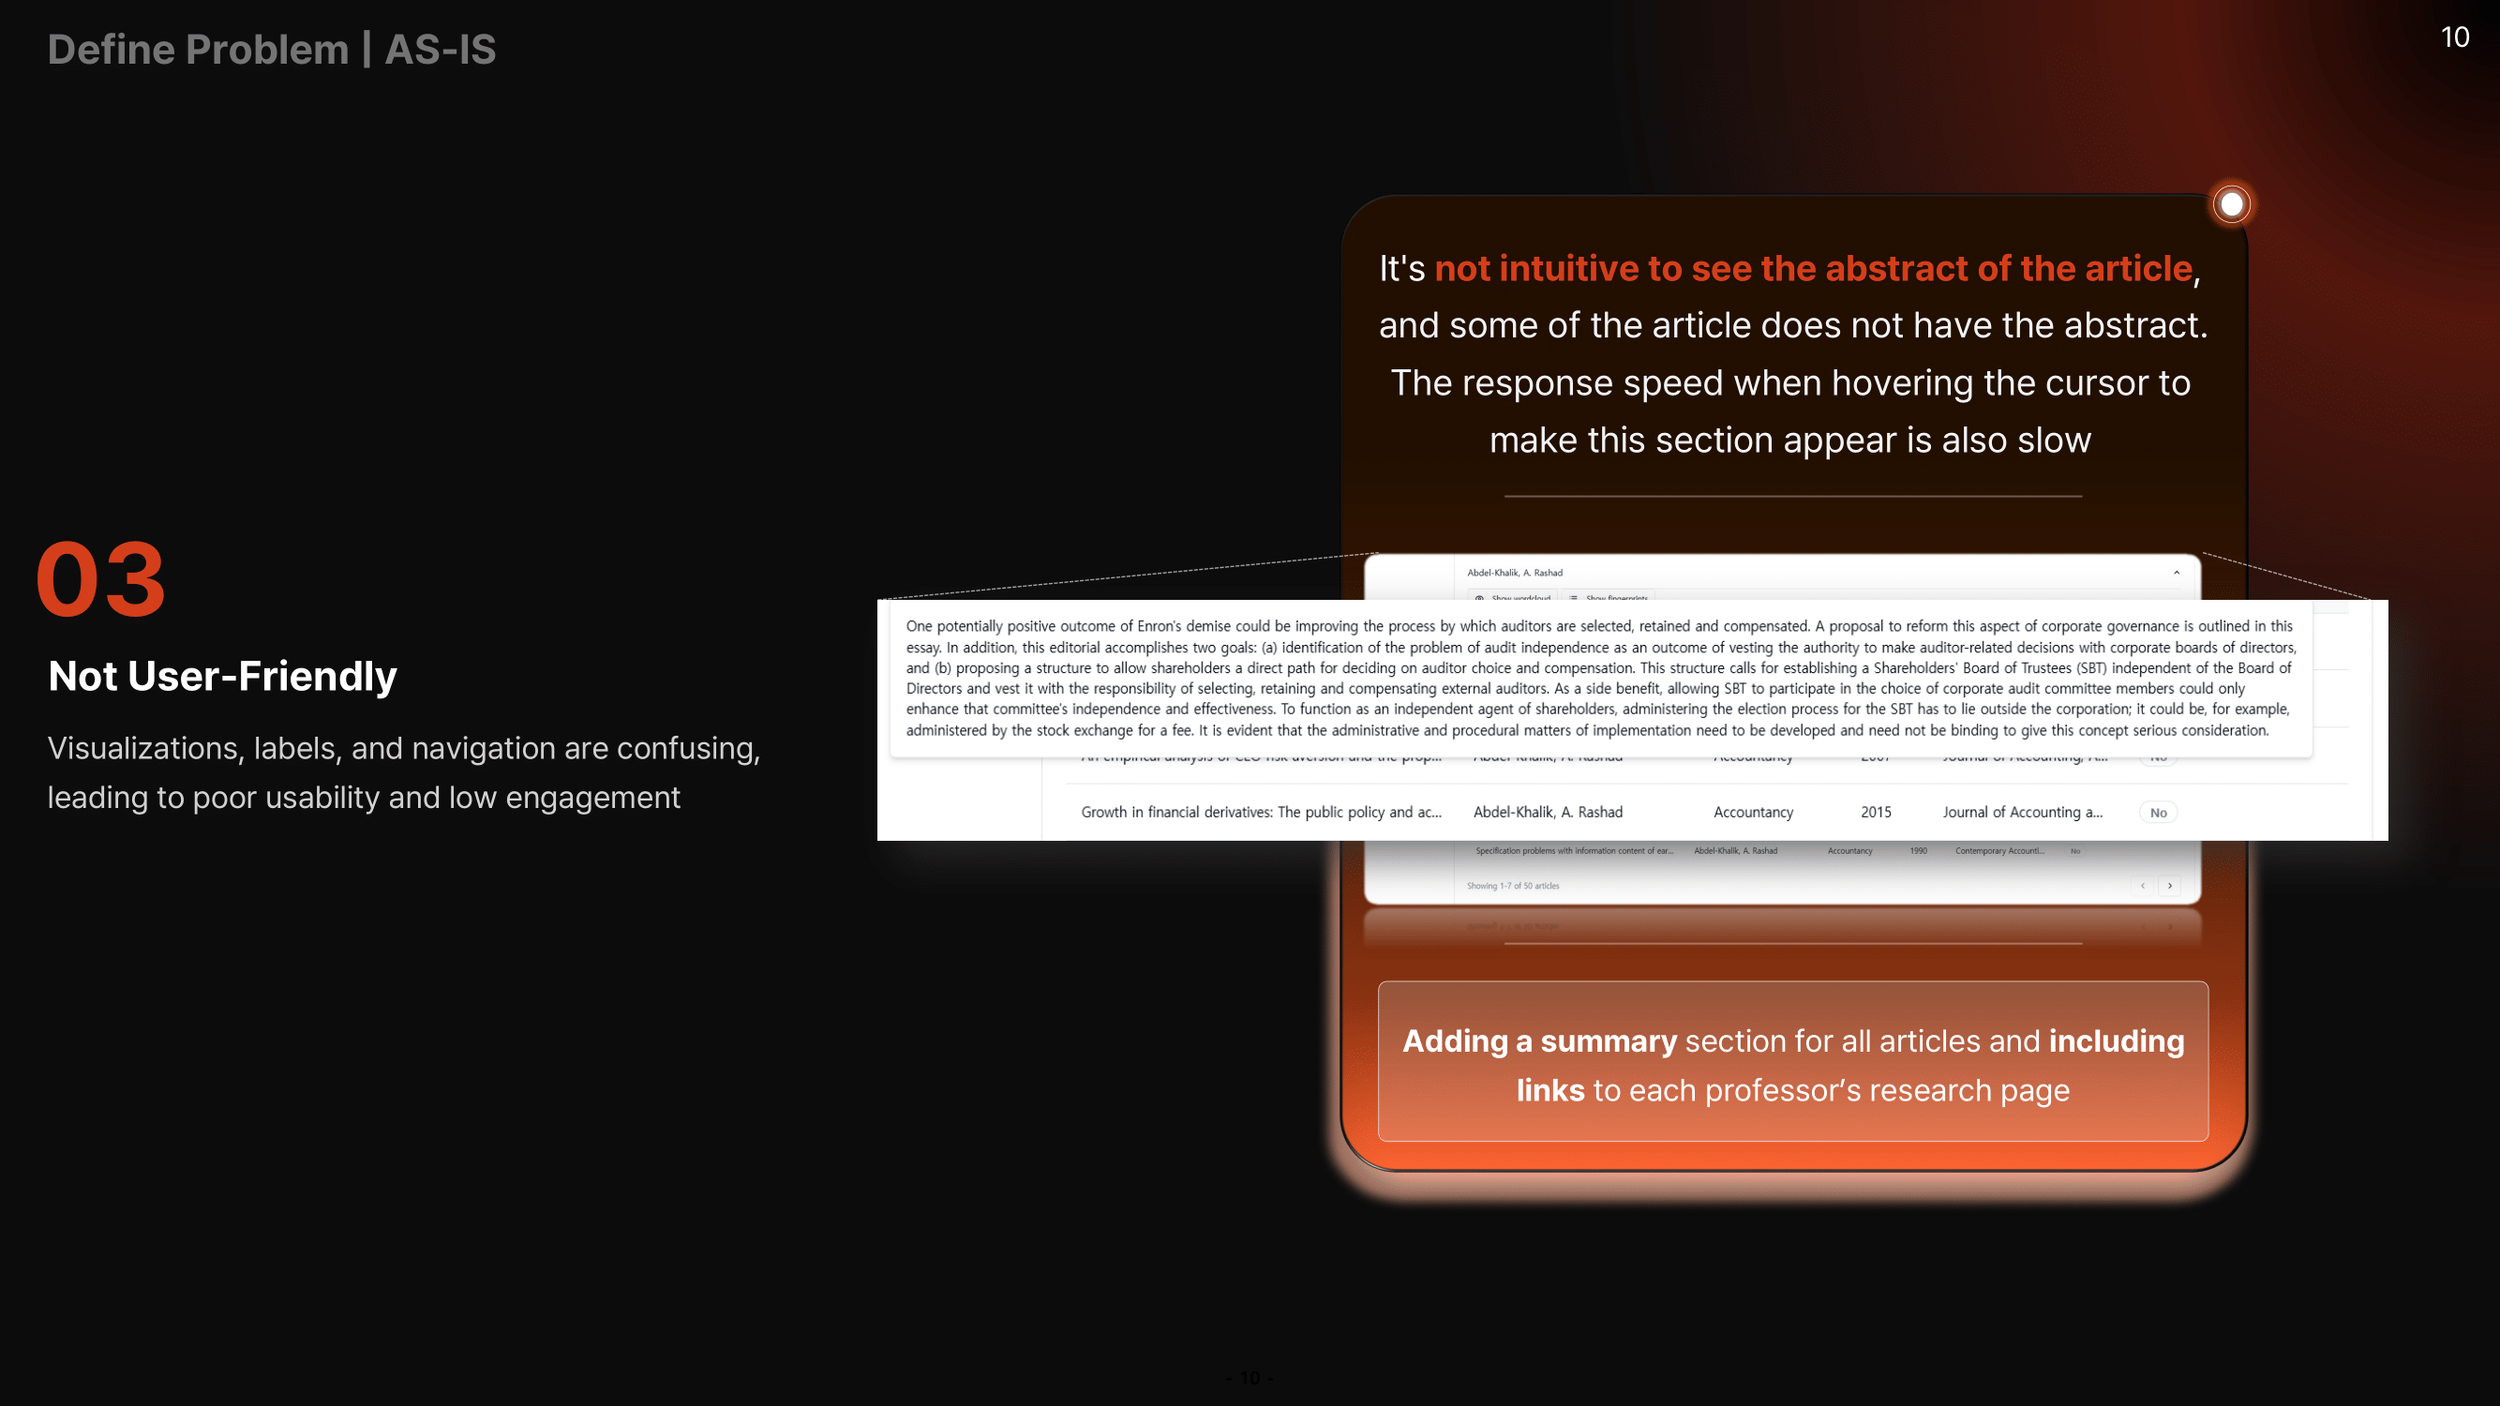
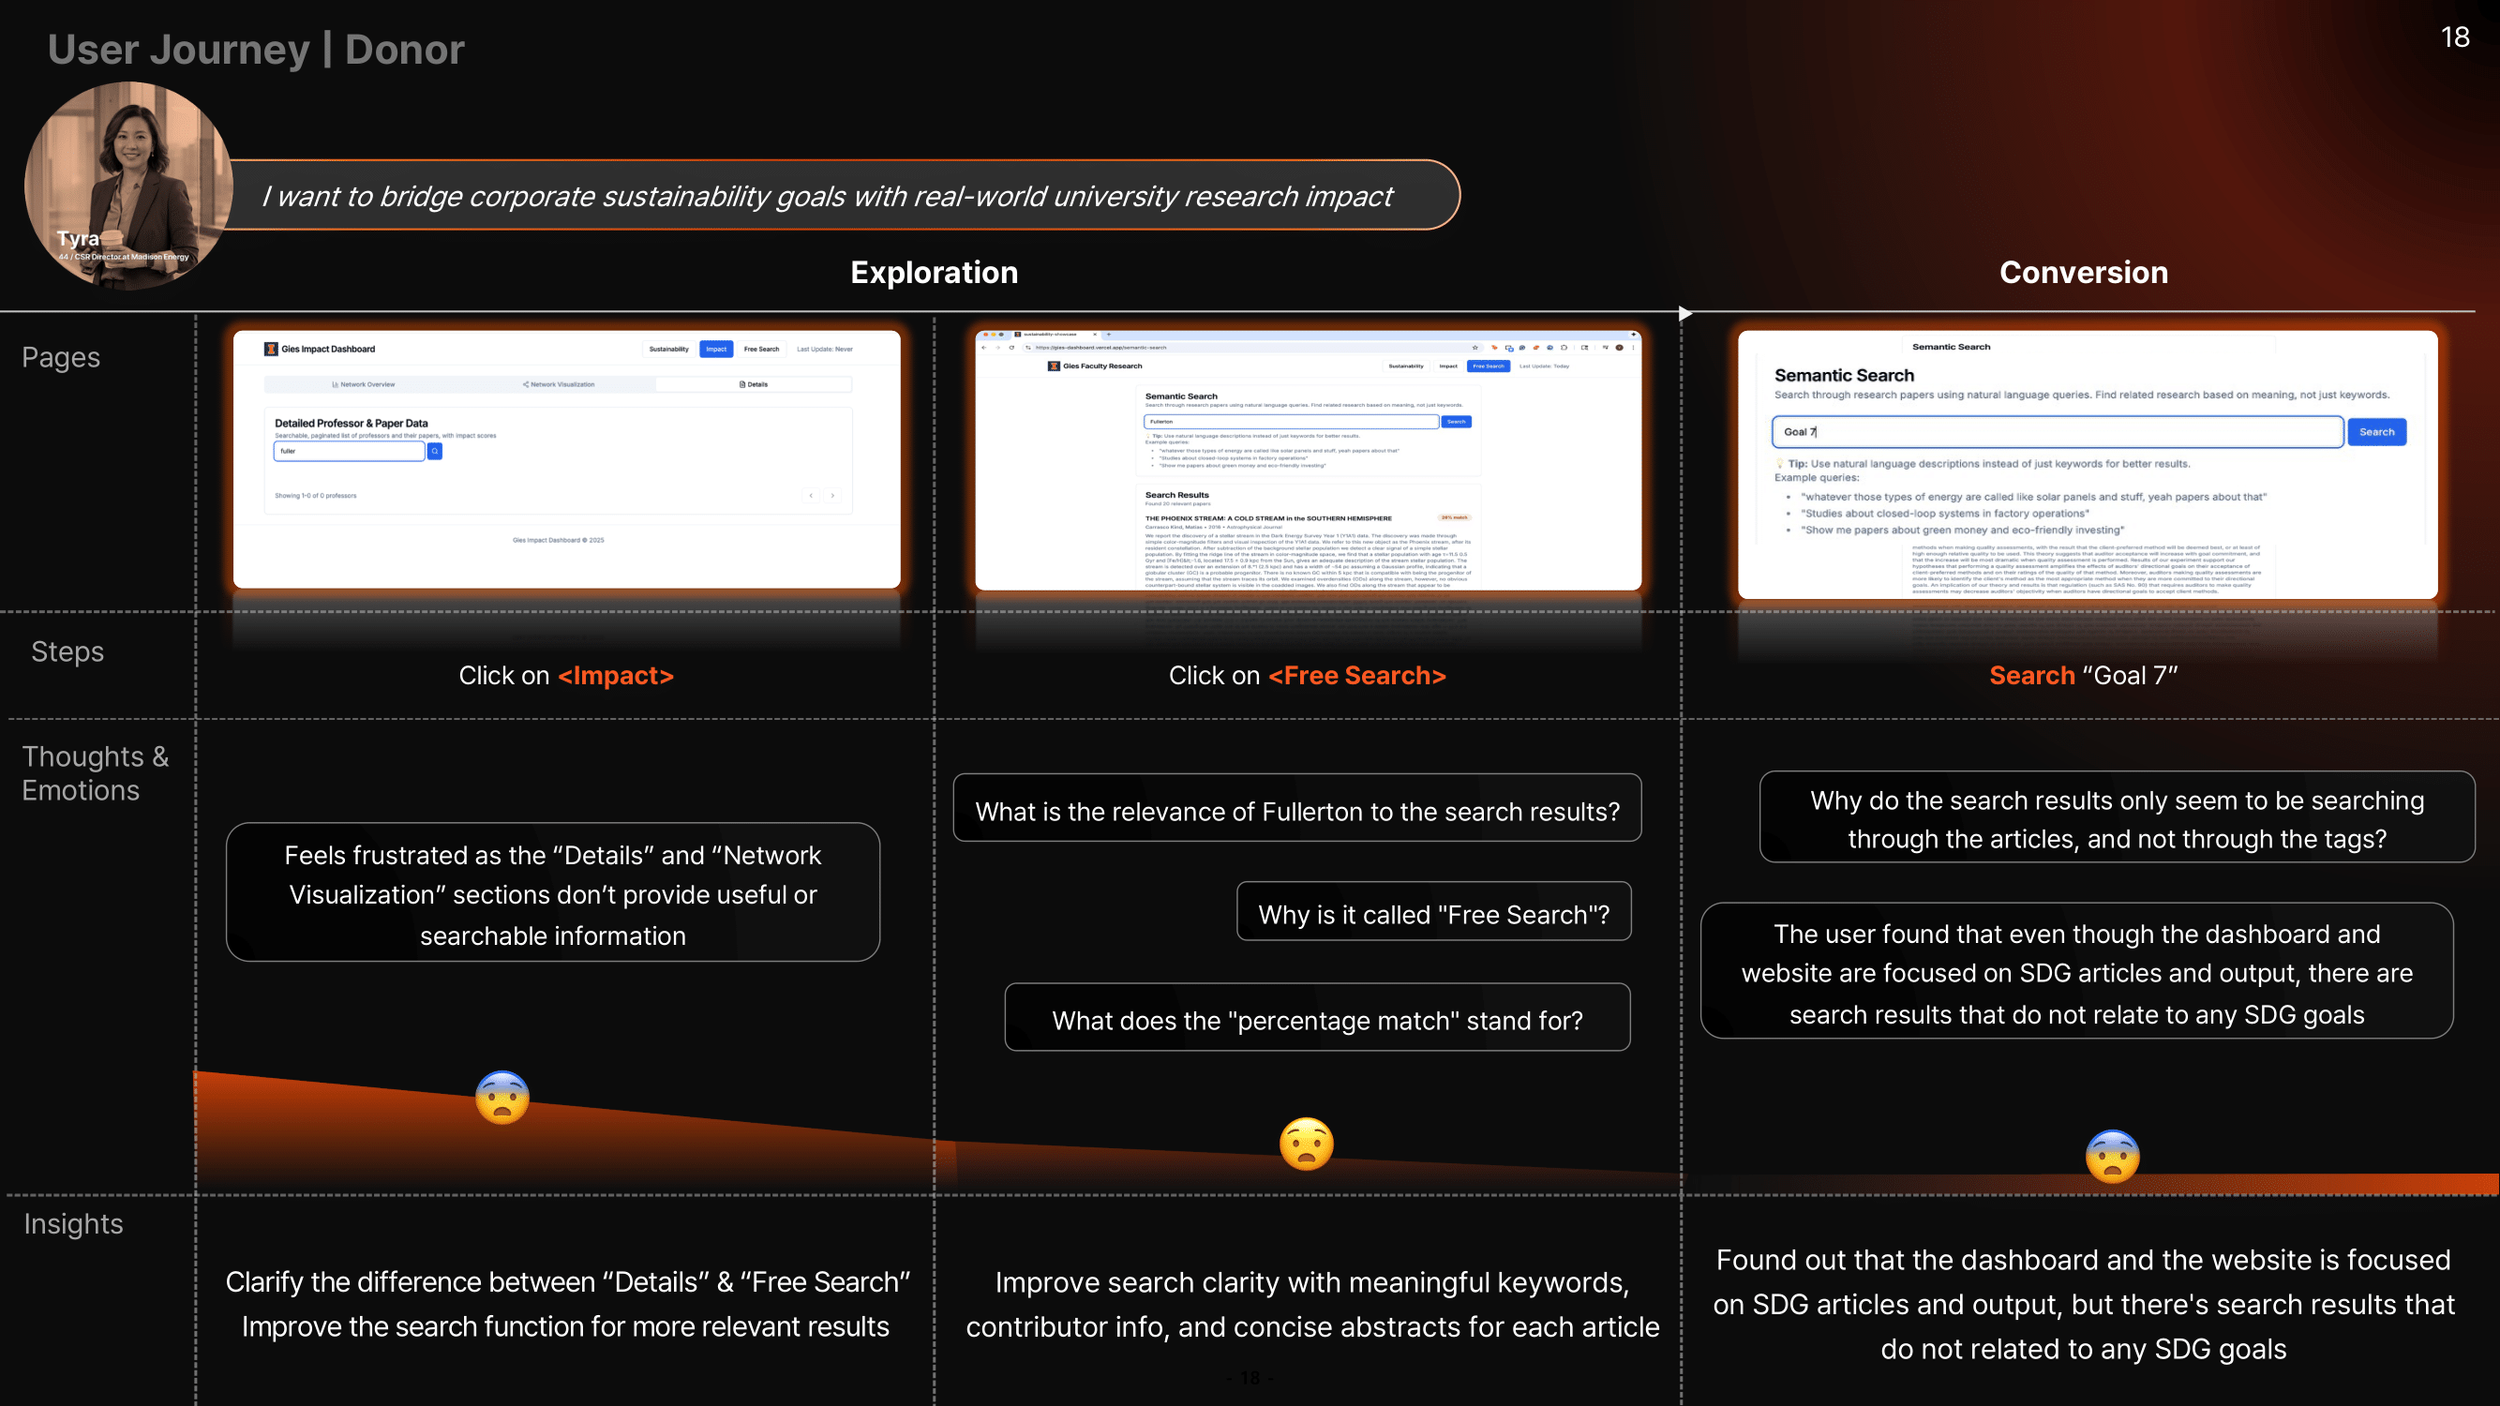
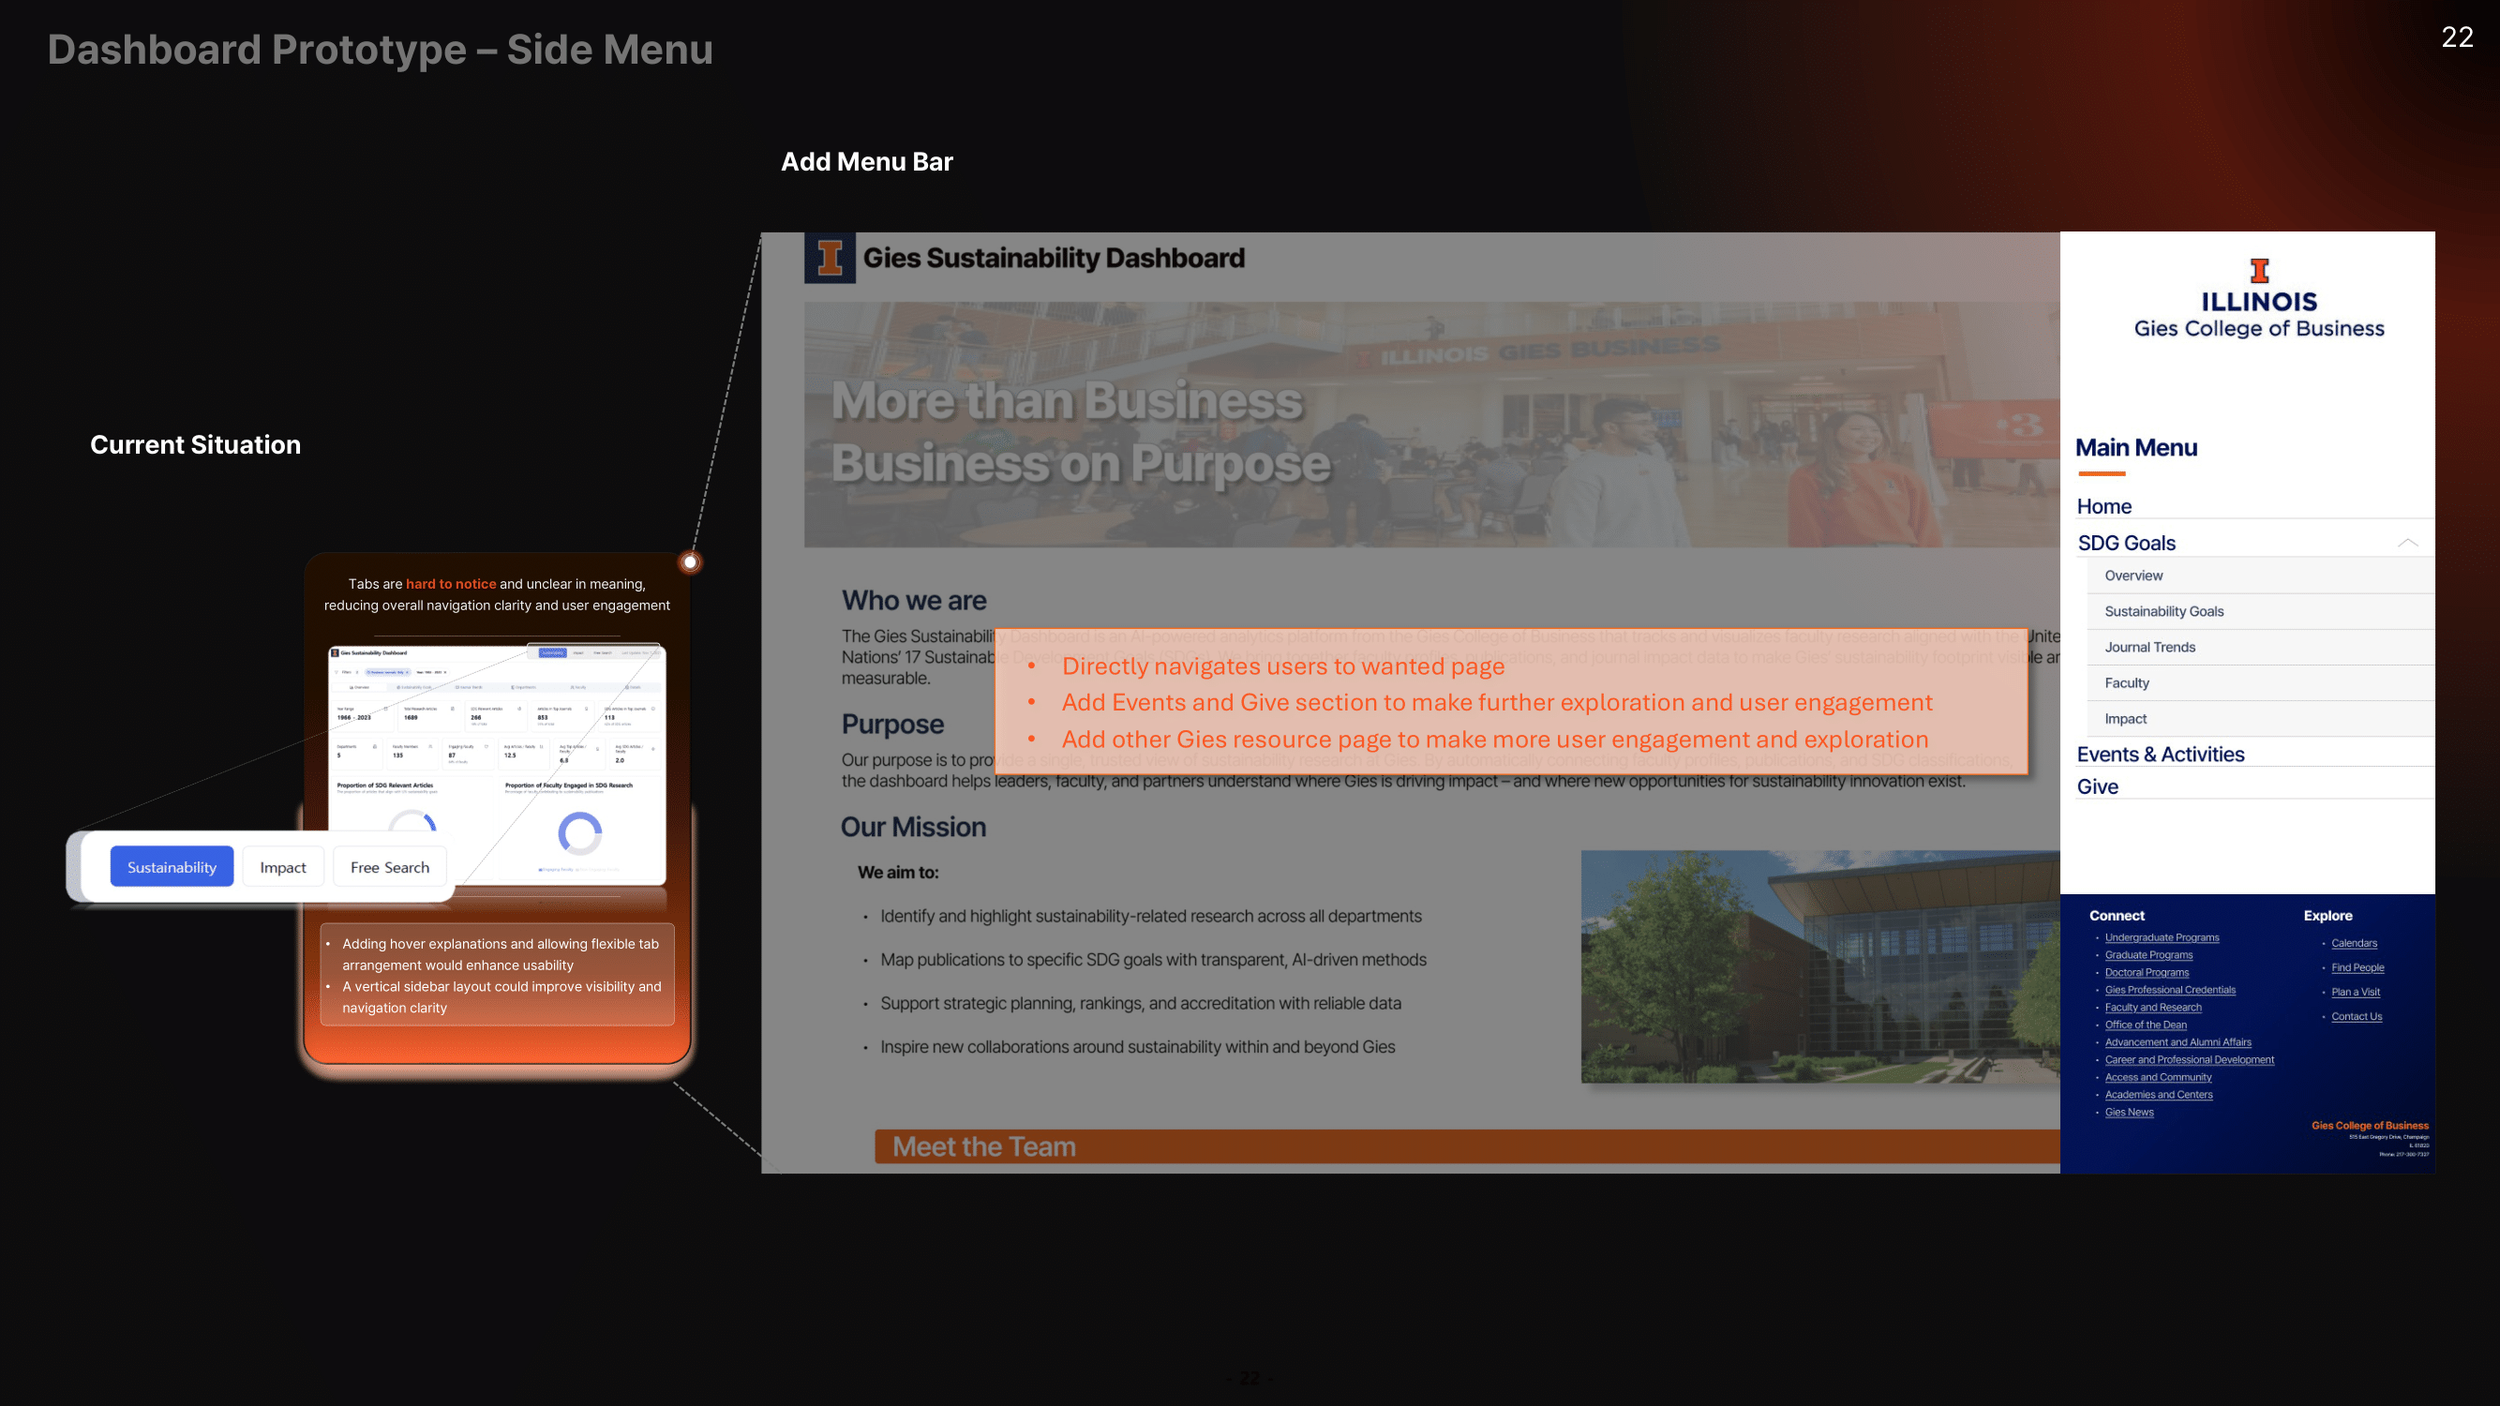
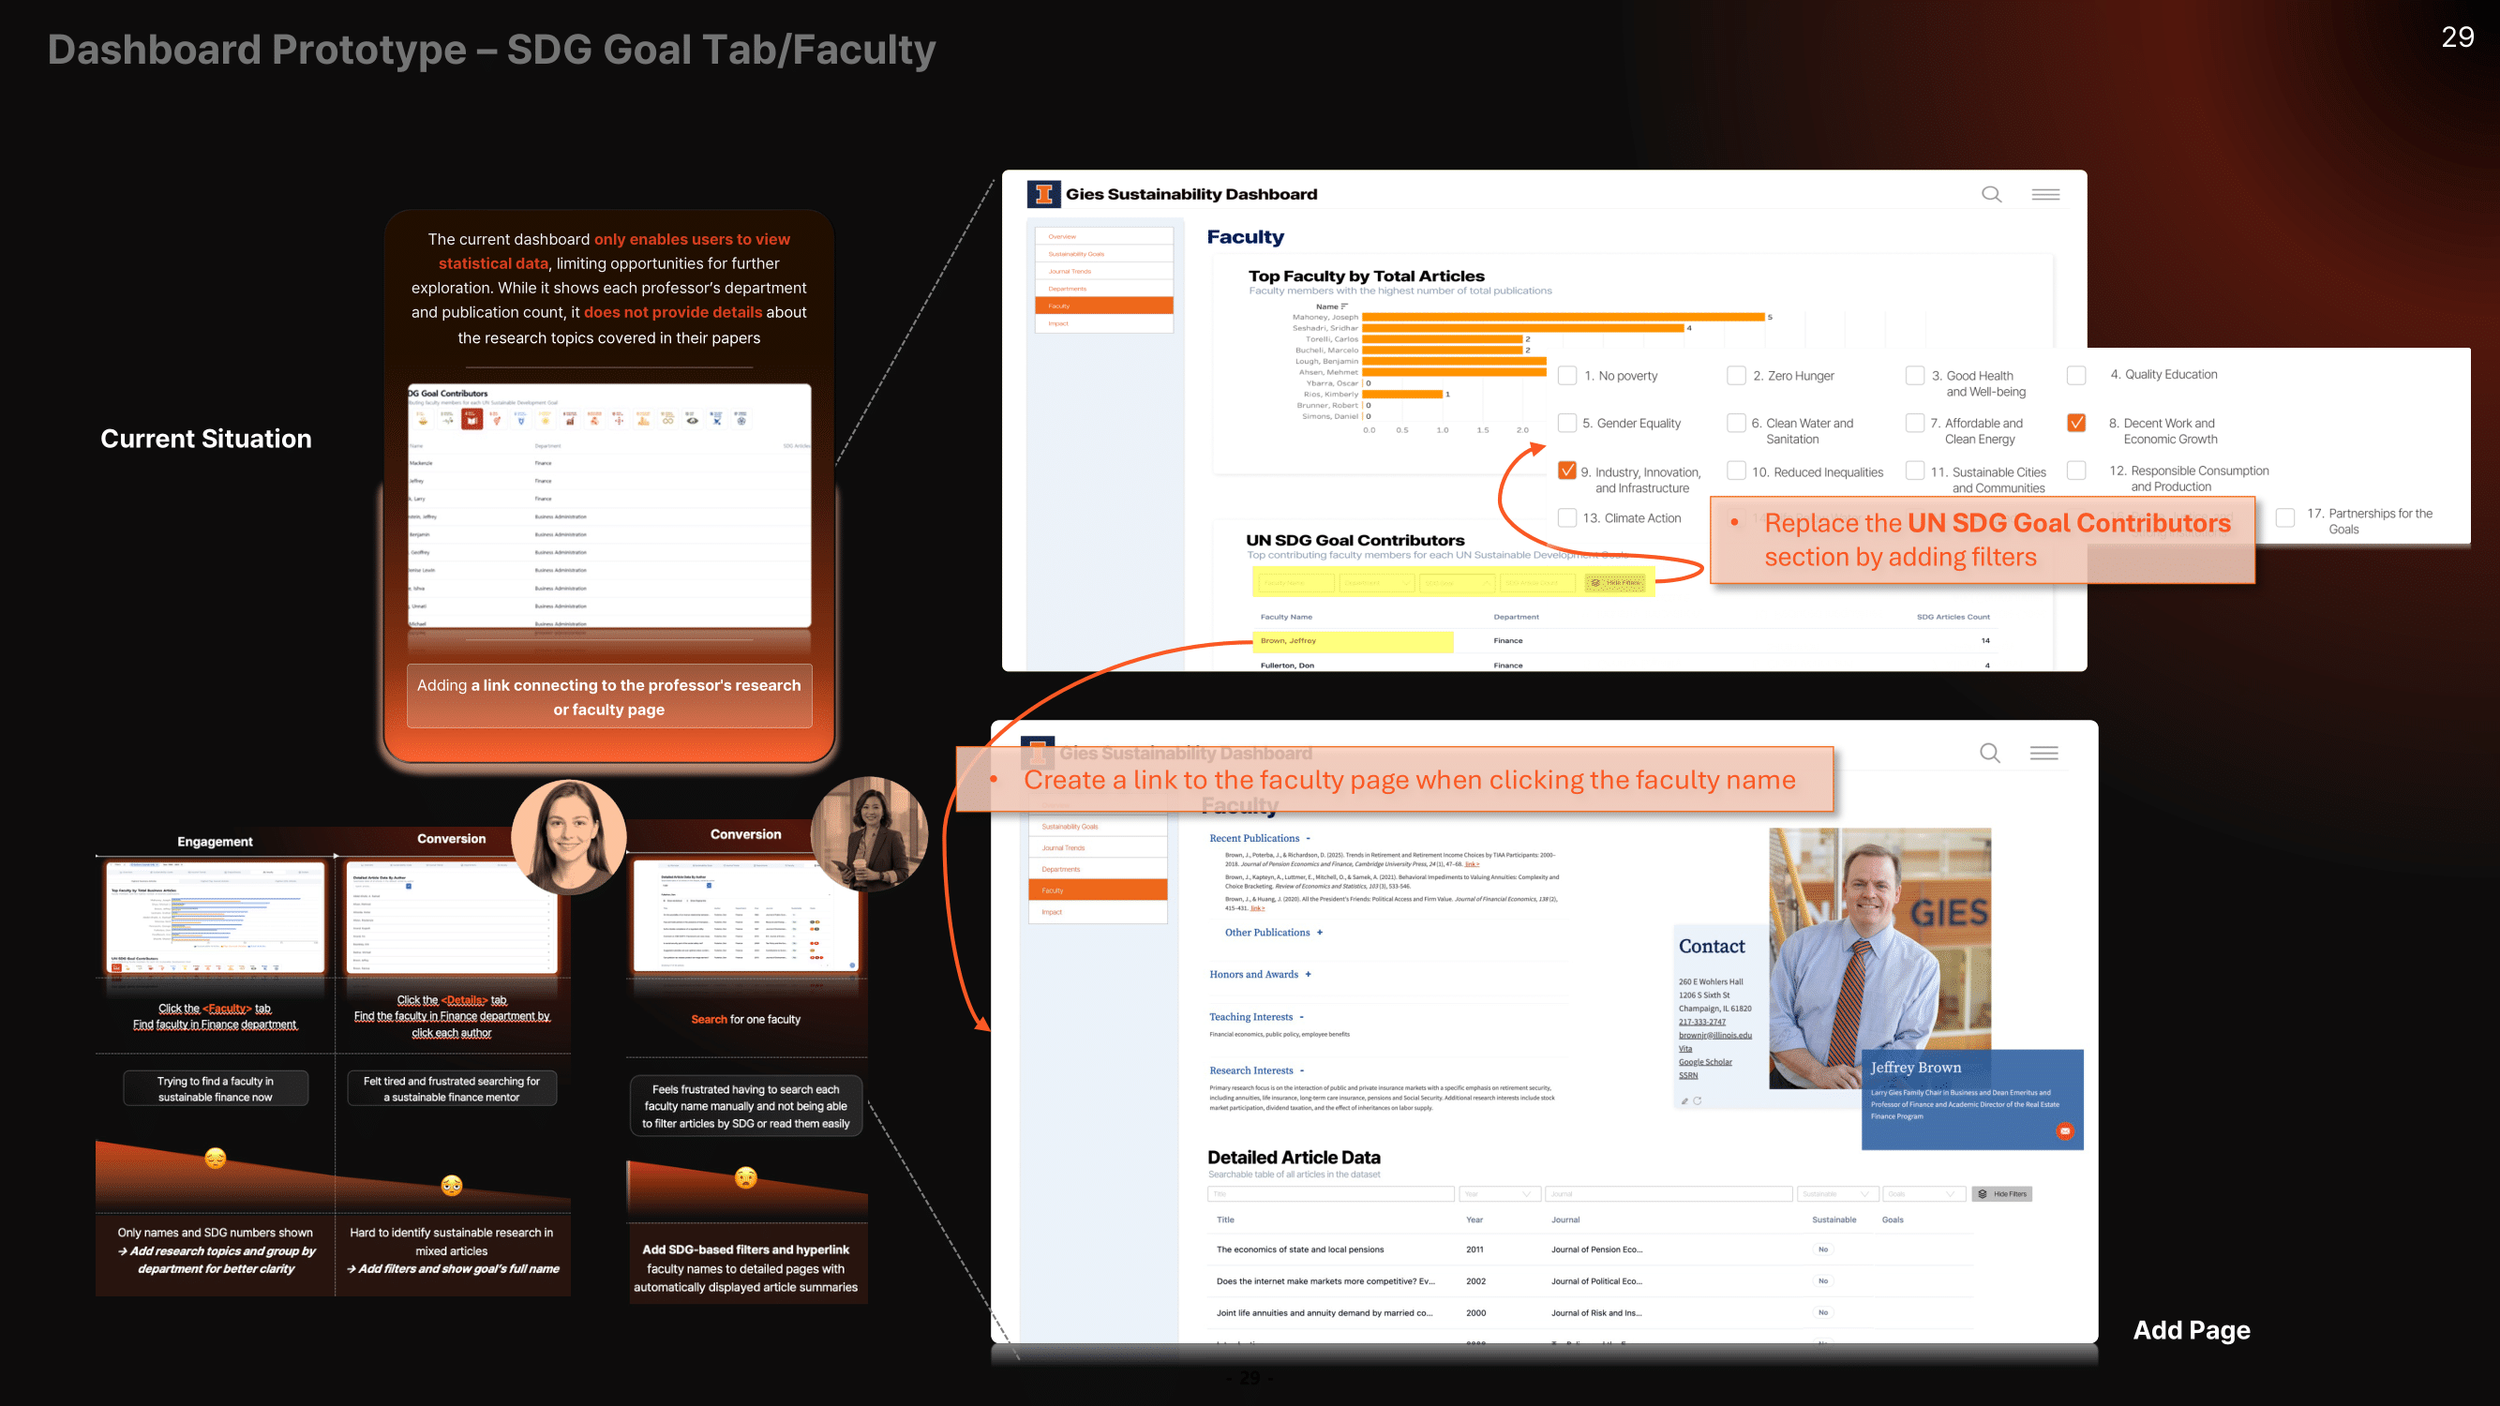
• Confusing navigation
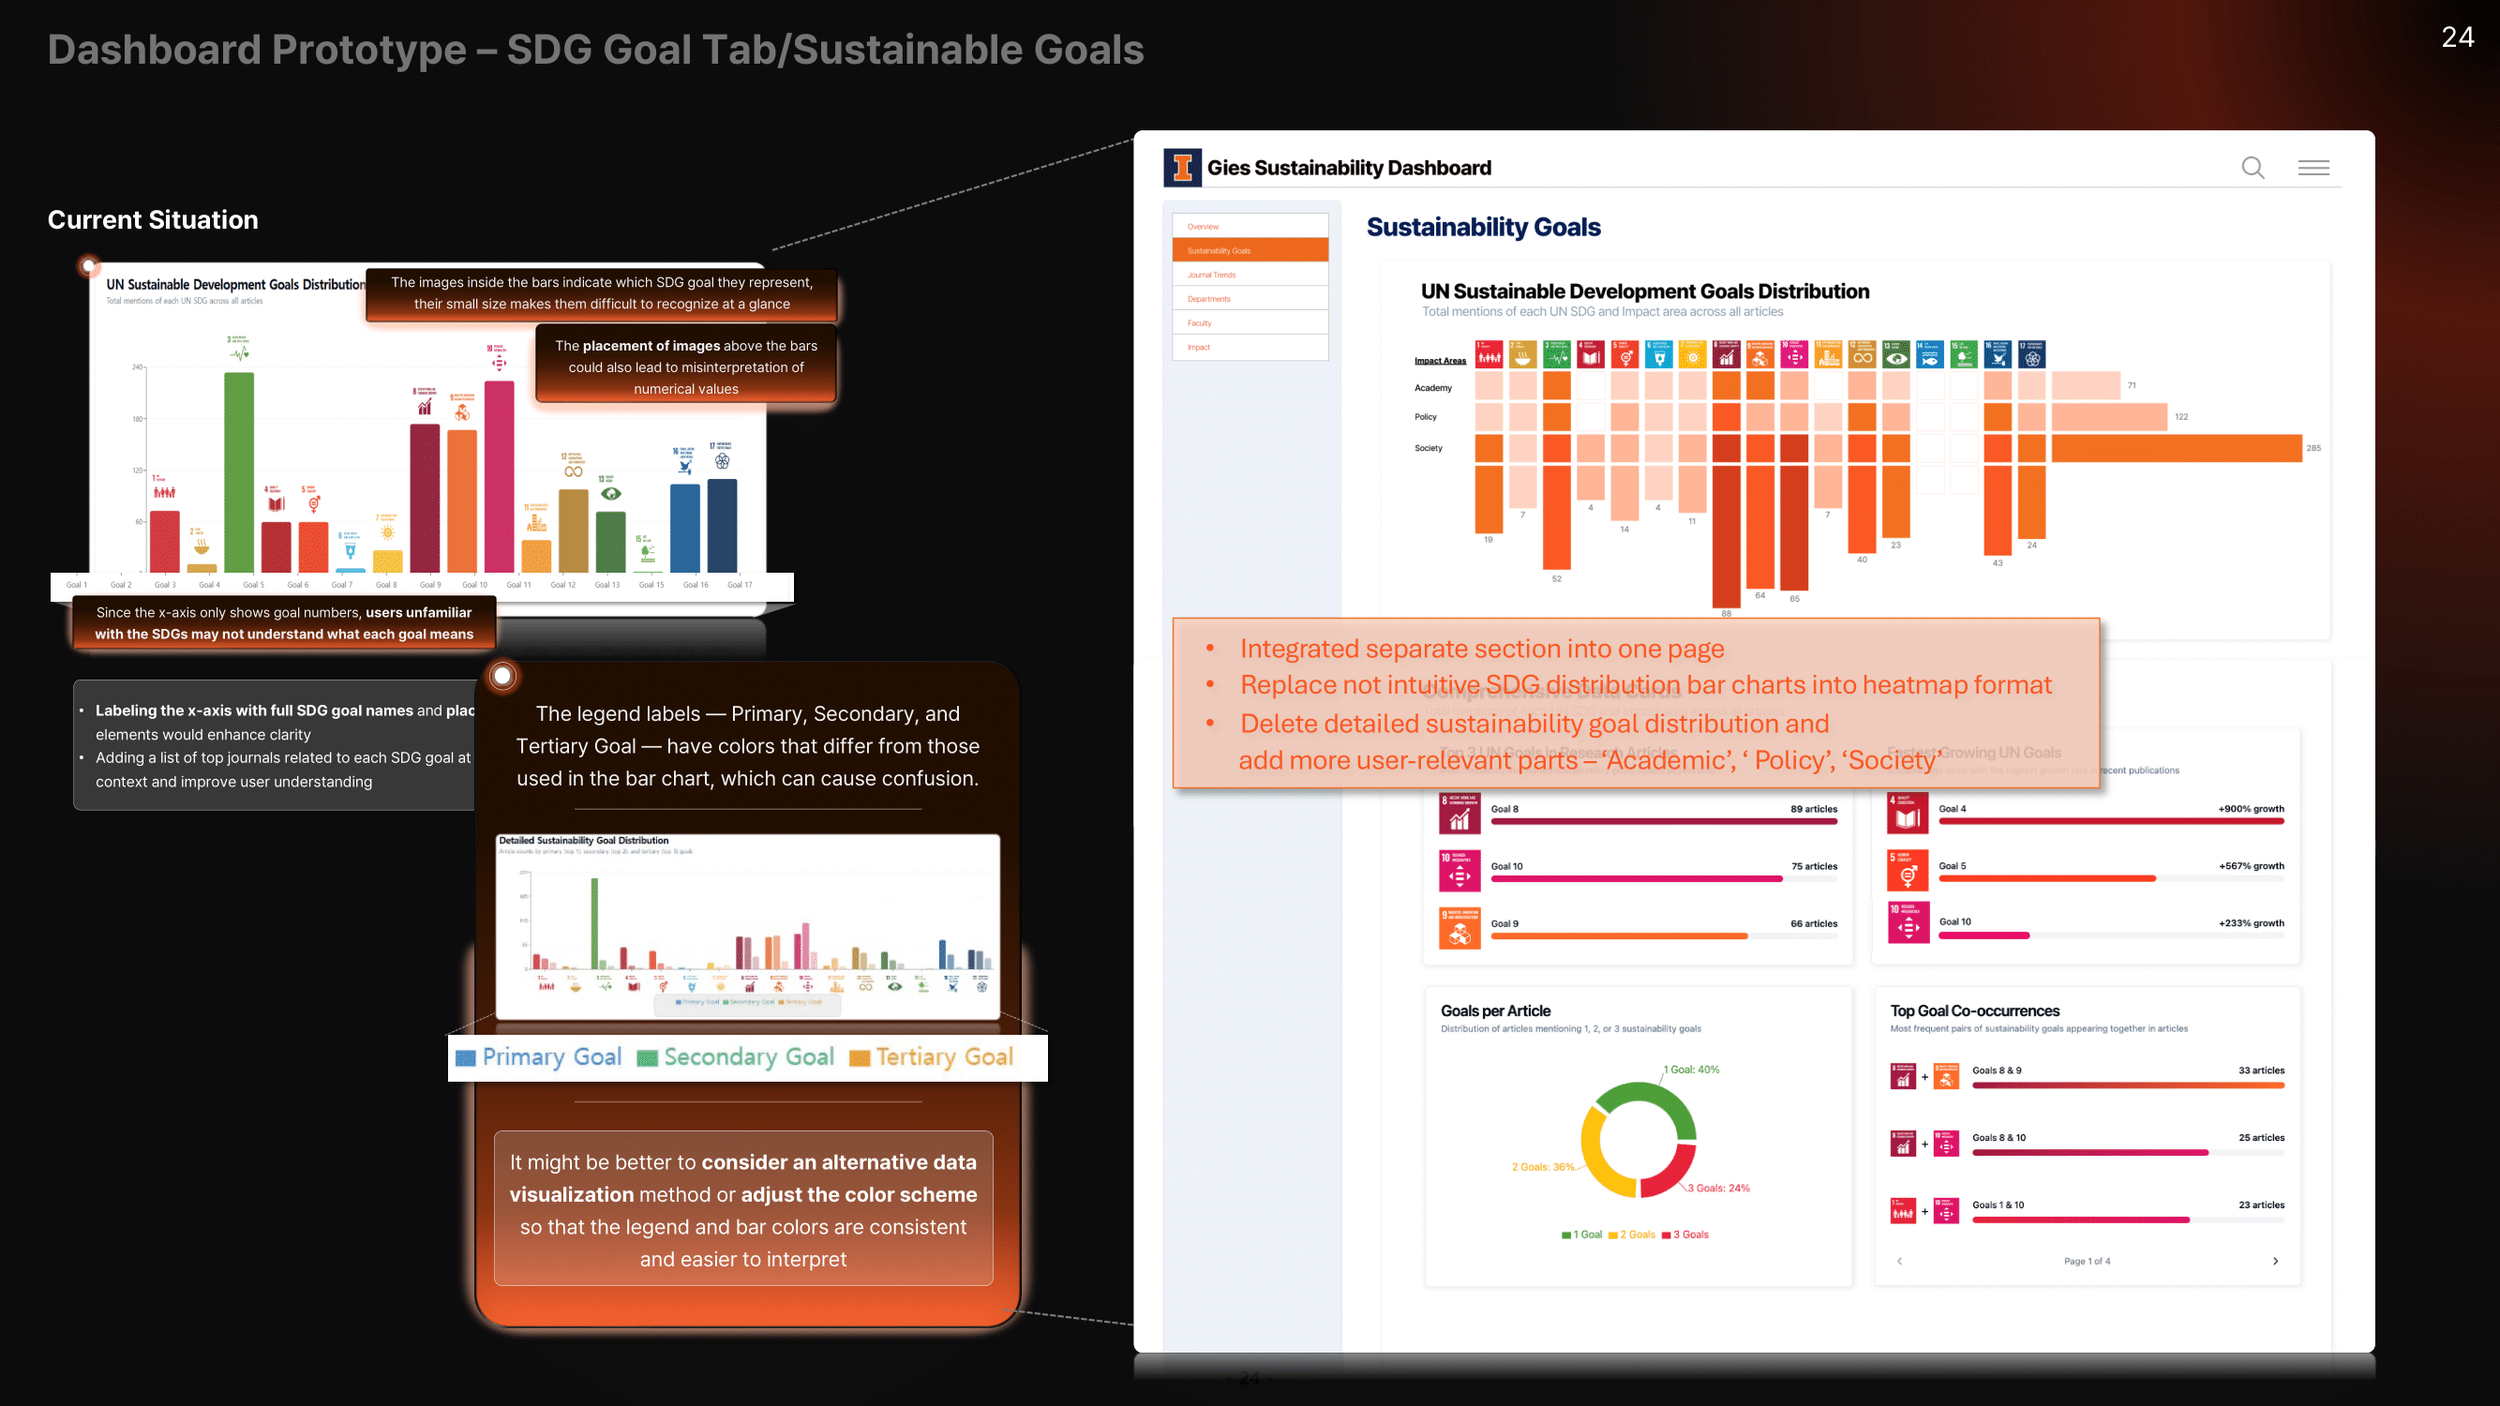
• Inconsistent legend colors
• Limited drill-down capability
• Slow hover response
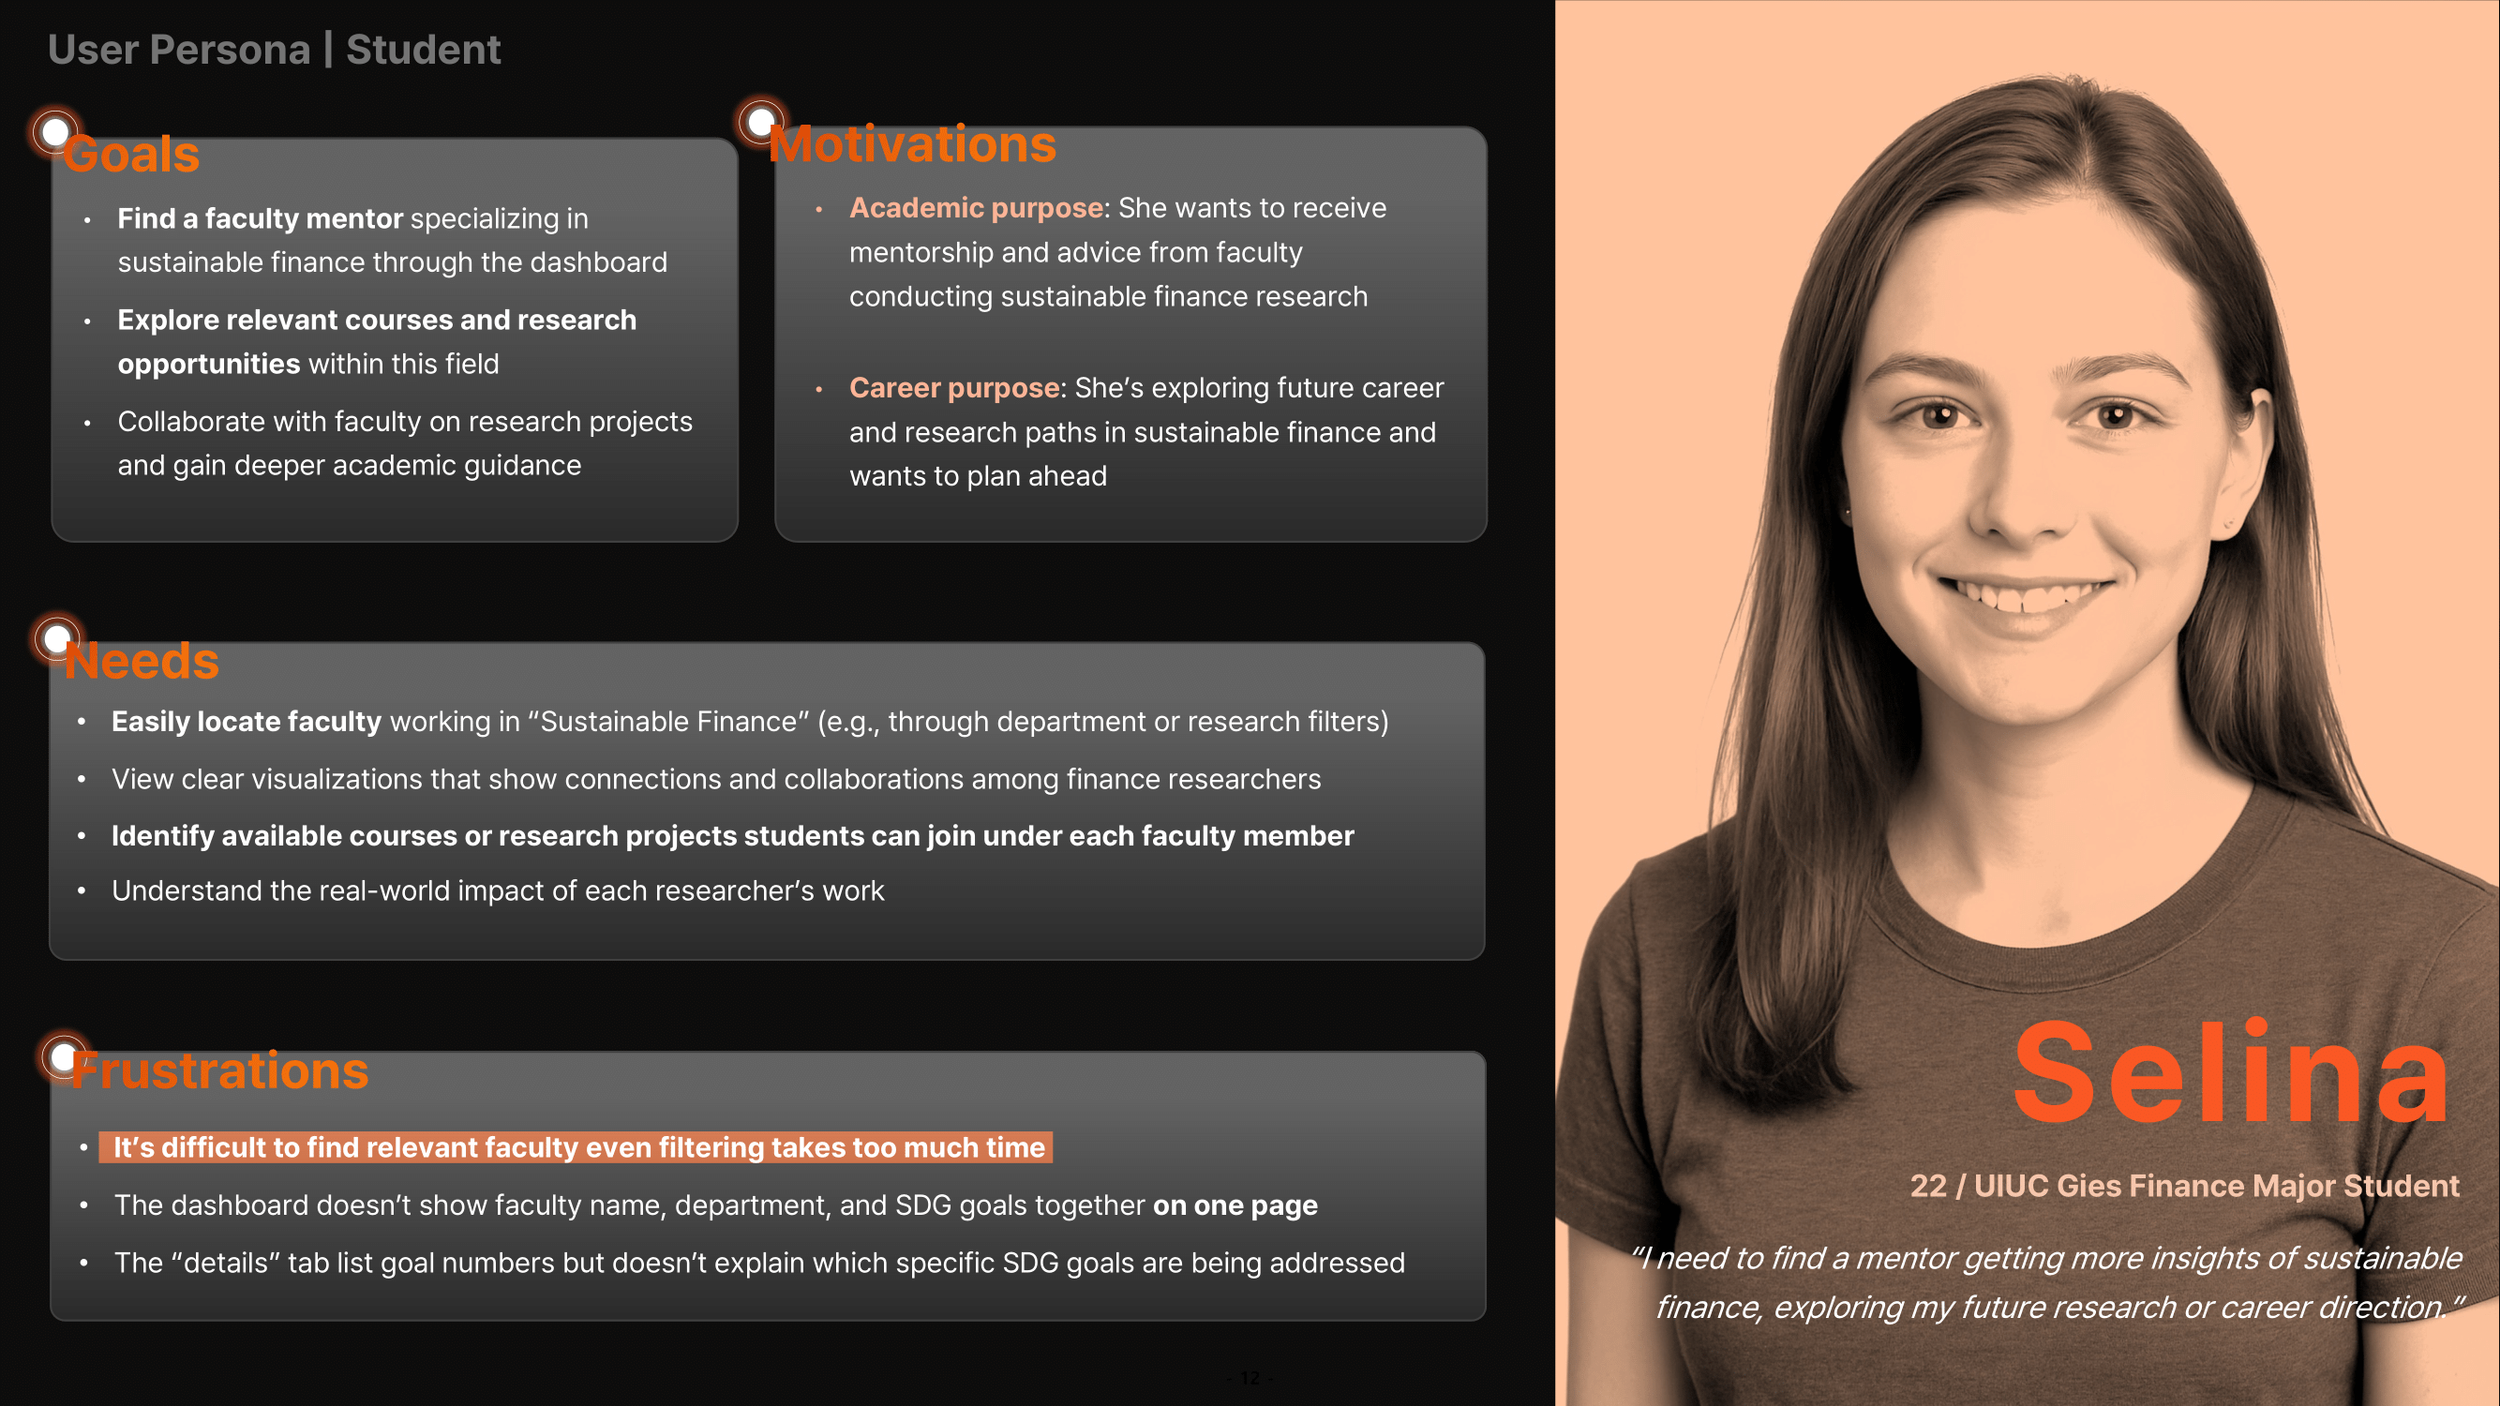
• No faculty-topic transparency