Wholesale Retail Client’s
Predictive Analytics Project
~20%
HIGHER EARLY SALES (AIM + OneSource)
2,879
STORES ANALYZED
3mo
CRITICAL LAUNCH WINDOW
Tech Stack
Python · pandas · statsmodels · scikit-learn · matplotlib ·
seaborn · Excel (Pivot Tables) ·
Regression · Log-Linear OLS
+1.9%
HIGHER SHELF PERSISTENCE (Both Programs)
01. Project Overview
THE BUSINESS PROBLEM
Company A — one of the largest member-owned grocery cooperatives in the United States — introduced new products across hundreds of independently operated member stores in 2024. To support store adoption, the company operates two programs: the AIM Auto-Ship Program, which automatically distributes new items to participating stores, and the One Source Program, which provides in-store merchandising support through Acosta representatives.
The key business question was straightforward: Do these programs meaningfully improve new product performance? And if so, which program — or combination of programs — leads to faster adoption and stronger early sales after launch?
Our Focus
The critical first 3 months after a product launches — the window where shelf access decisions are made, early consumer adoption is won or lost, and program execution differences are most visible.
📦
AIM Auto-Ship
Automatically ships new company-listed products to participating stores upon launch. Removes the friction of manual ordering.
Supply-side push
VISUALIZE
Add a regression coefficient plot with error bars — showing confidence intervals around the ~20% estimate would demonstrate statistical rigor and make the uncertainty visible to technical reviewers.
Add division-level heatmap — showing which geographic regions had the highest "Both" program concentration alongside strongest launch performance would surface actionable geographic insights.
Key Insight
Early distribution speed is a leading indicator of long-term sales success. Programs that accelerate placement in the launch window create compounding advantages that are hard to close later.
The Three Programs We Compared
🤝
One Source
Places dedicated field merchandising reps in stores who help set shelves, verify distribution, and support early sell-through.
In-store execution
🌟
02. Dataset
WHAT WE WORKED WITH
Company A provided store-level sales transaction data for new product launches in 2024, along with store lists identifying which locations were enrolled in each support program. We merged, cleaned, and structured these datasets into an analysis-ready format using a five-notebook Python data processing pipeline.
The final dataset was organized at the Store × Item × Month level, enabling us to track early sales performance and product adoption during the first six months after launch.
77%
NONE (2,234)
12.4%
ONE SOURCE (357)
5.2%
AIM (150)
Both Programs
Stores enrolled in both AIM and One Source receive automated supply plus active in-store merchandising support.
Combined approach
4.8%
BOTH (138)
03. Methodology
HOW WE ANALYZED IT
We approached the analysis through two complementary lenses: descriptive analysis to understand the overall patterns in the data, and regression modeling to isolate the true effect of program participation while controlling for product-level differences.
This dual approach was essential because the program groups were highly imbalanced. The “None” group contained roughly 15× more stores than the “Both” program group, meaning simple averages could reflect store composition rather than program effectiveness.
By applying regression controls for individual products, we ensured that comparisons were made on an equivalent product basis, allowing us to evaluate how program participation influenced sales performance for the same item across different stores.
-
Merged four raw data sources (store lists, AIM participation lists, One Source program lists, and transaction-level sales data) into a clean store × item × month panel dataset.
Standardized store identifiers, removed duplicates, and assigned each store to a single program category (AIM, One Source, Both, or None). Rows missing critical fields were filtered out to ensure analytical reliability. -
Analyzed product distribution across stores over the first 12 months after launch to examine how quickly each program group adopted new items.
Used cumulative distribution curves to measure rollout speed, allowing us to compare not only final product reach but also the pace at which items appeared on store shelves. -
Estimated a logistic regression model predicting whether a store–item pair appeared on shelves within the first 3 months of launch.
Including item fixed effects controls for inherent product quality and popularity, isolating the program's contribution to early shelf placement. -
Modeled log(1 + sales) during the three-month launch window using an item fixed-effects OLS regression.
The log transformation addresses strong right-skew in the sales distribution, allowing coefficients to be interpreted as percentage differences in early sales relative to the “None” program baseline. -
Introduced division (geographic region) and product category controls to account for regional demand differences and category-level variation.
These controls ensure that observed sales patterns are attributed to program participation rather than underlying market or product characteristics.
04. Key Findings
WHAT THE DATA REVEALED
Both models pointed to the same consistent pattern. Stores participating in both programs performed the strongest, followed by One Source alone, then AIM alone. Across both shelf placement and early sales performance, the combined program produced the most effective new product launches.
These results remained stable even after controlling for product-level differences through item fixed effects, confirming that the observed performance differences were driven by program participation rather than inherent product popularity.
Highly Imbalanced Groups
77% of stores are in "None." This imbalance increases variance in the smaller groups and may reduce statistical power for detecting subtle effects — though the main findings are statistically significant.
05. Business Impact
WHAT THIS MEAN FOR THE CLIENT
The analysis provides a clear, data-backed answer to a question with real commercial implications: prioritizing the combined AIM + One Source approach would likely deliver the strongest outcomes for new product launches. Stores participating in both programs consistently achieved faster rollout and stronger early sales, suggesting that scaling the combined model could significantly improve launch performance across the network.
If you'd like, I can also show you a slightly sharper “consulting-style insight” version that tends to look even stronger in portfolio case studies.
If the goal is maximizing early sales success of new items, "Both" is the program to scale — and the data now shows exactly why.
The results are especially compelling because they control for product quality. It's not that "Both" stores carry better products — it's that the program execution itself is delivering measurably better commercial outcomes for the same products.
~20%
Sales Uplift
vs No Program
📈 Strategic Recommendation
Company A should prioritize expanding enrollment in the combined Both
program. Even One Source alone delivers strong ROI — suggesting the in-store
merchandising component is the higher-leverage investment.
🔍 Worth Investigating
AIM alone underperforms relative to expectations. This raises a key operational
question: does automated shipping without in-store support lead to
products arriving but not being properly stocked or positioned?
06. Key Visualizations
CHARTS THAT TELL THE STORY
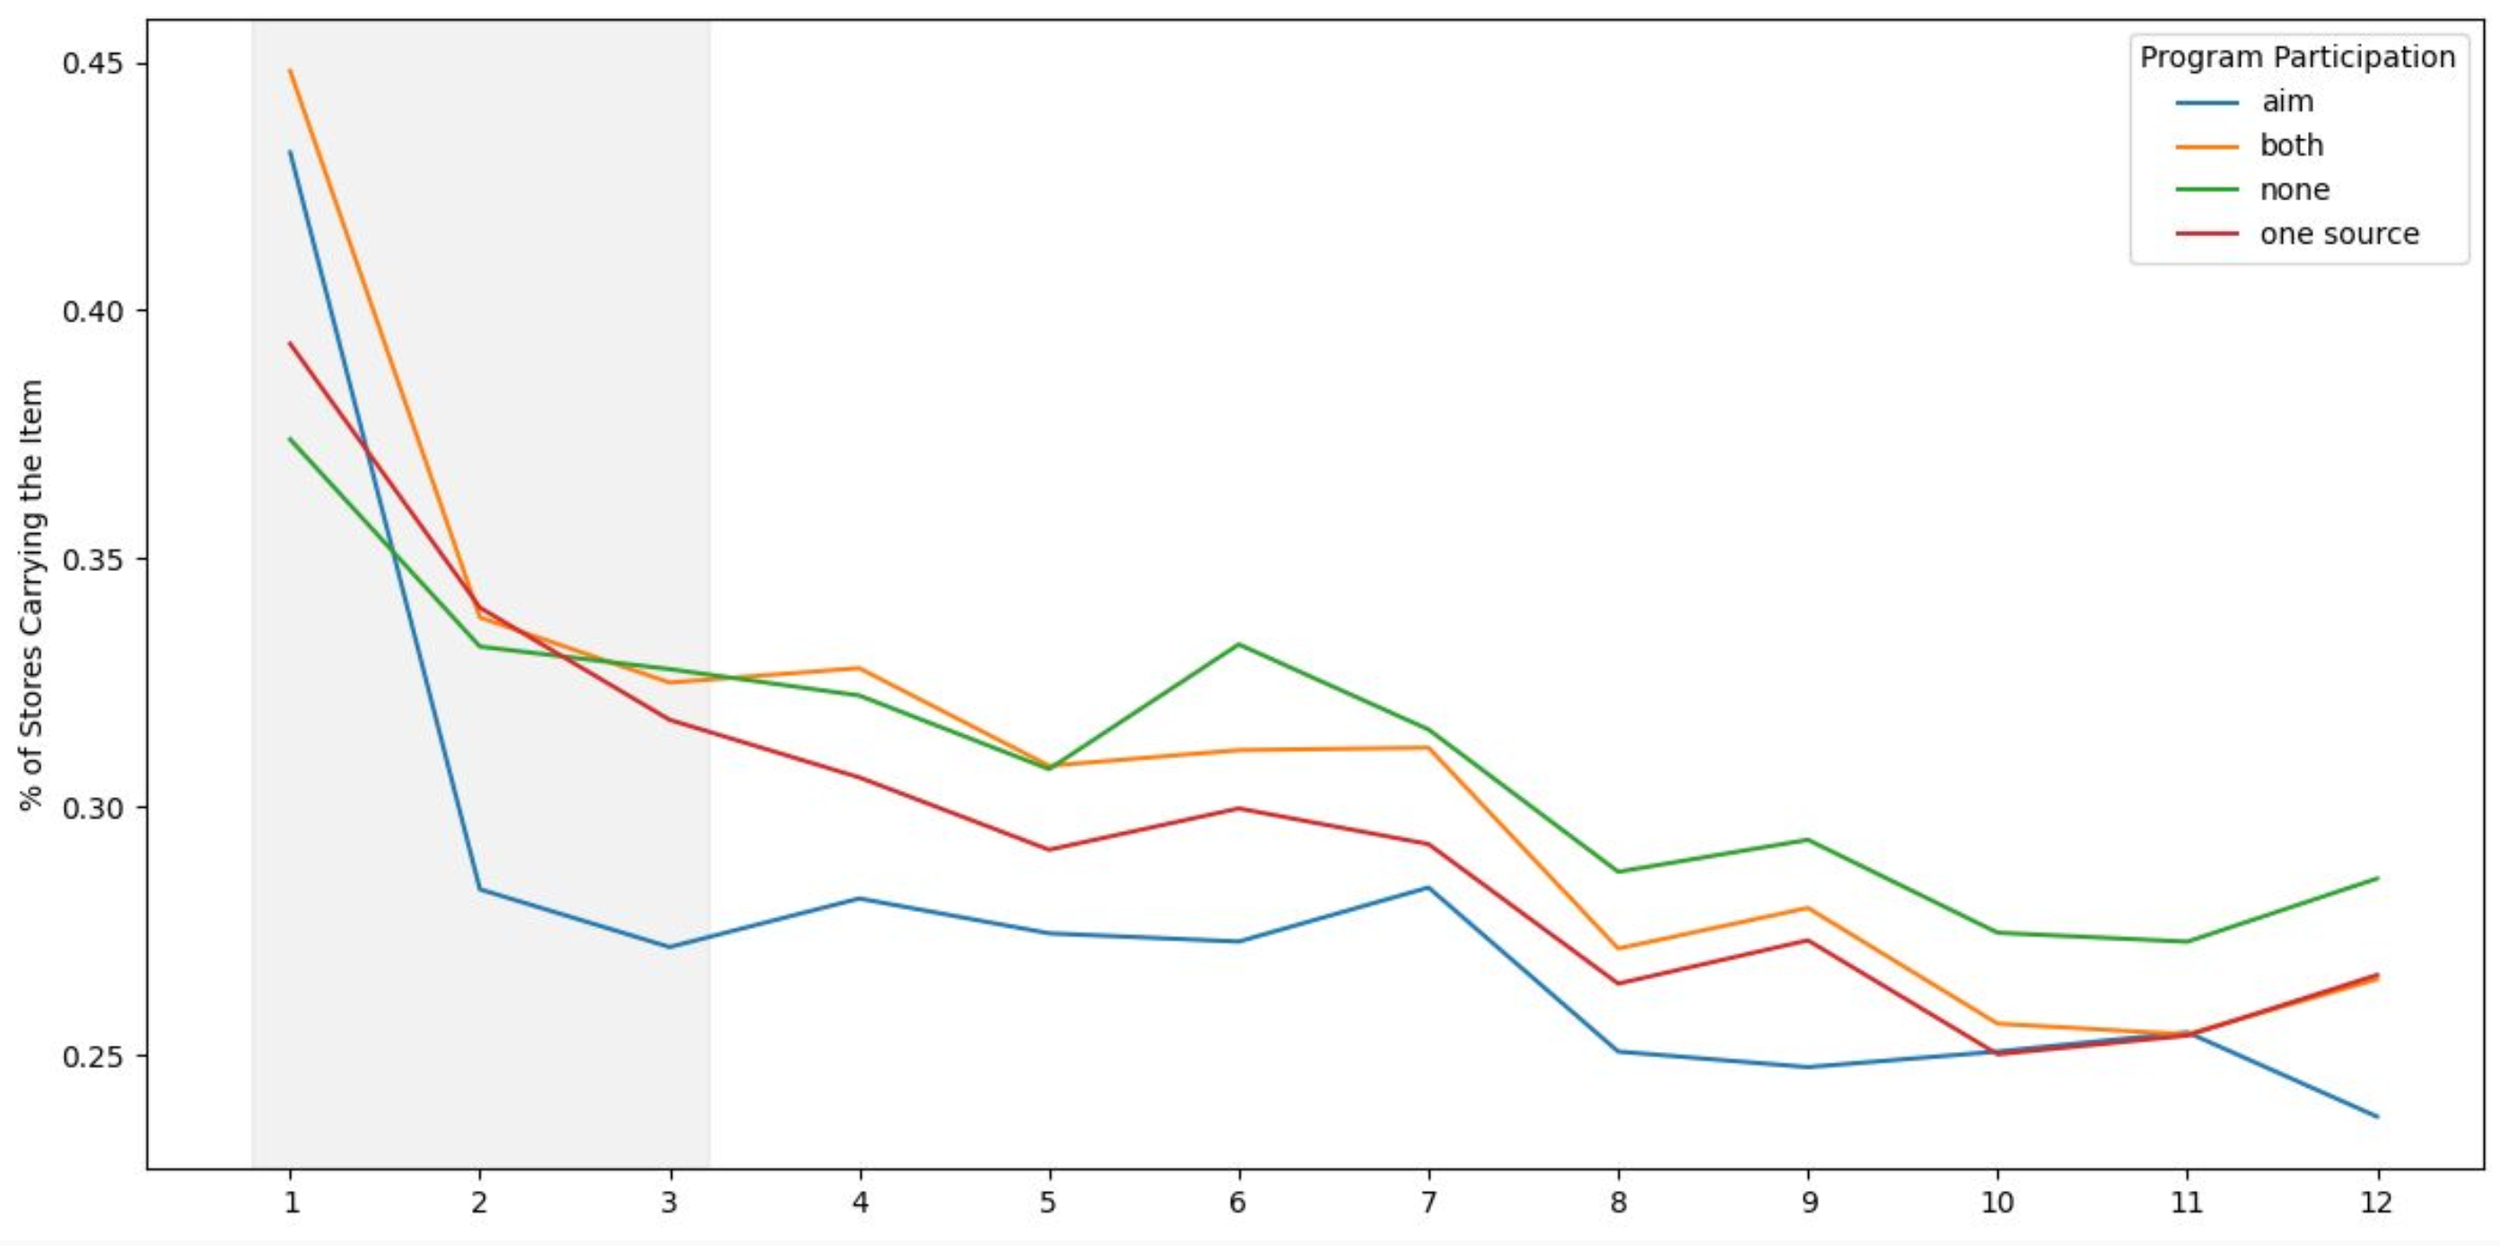
Item Distribution Over 12 Months by Program
This chart tracks how quickly products achieve distribution across stores over time. The gray M1–M3 window highlights the critical launch phase, where the “Both” program clearly leads in early placement. After M3, all programs converge, indicating that programs primarily impact speed of rollout rather than final distribution levels.
Statistically Controlled Sales Lift vs. None Baseline
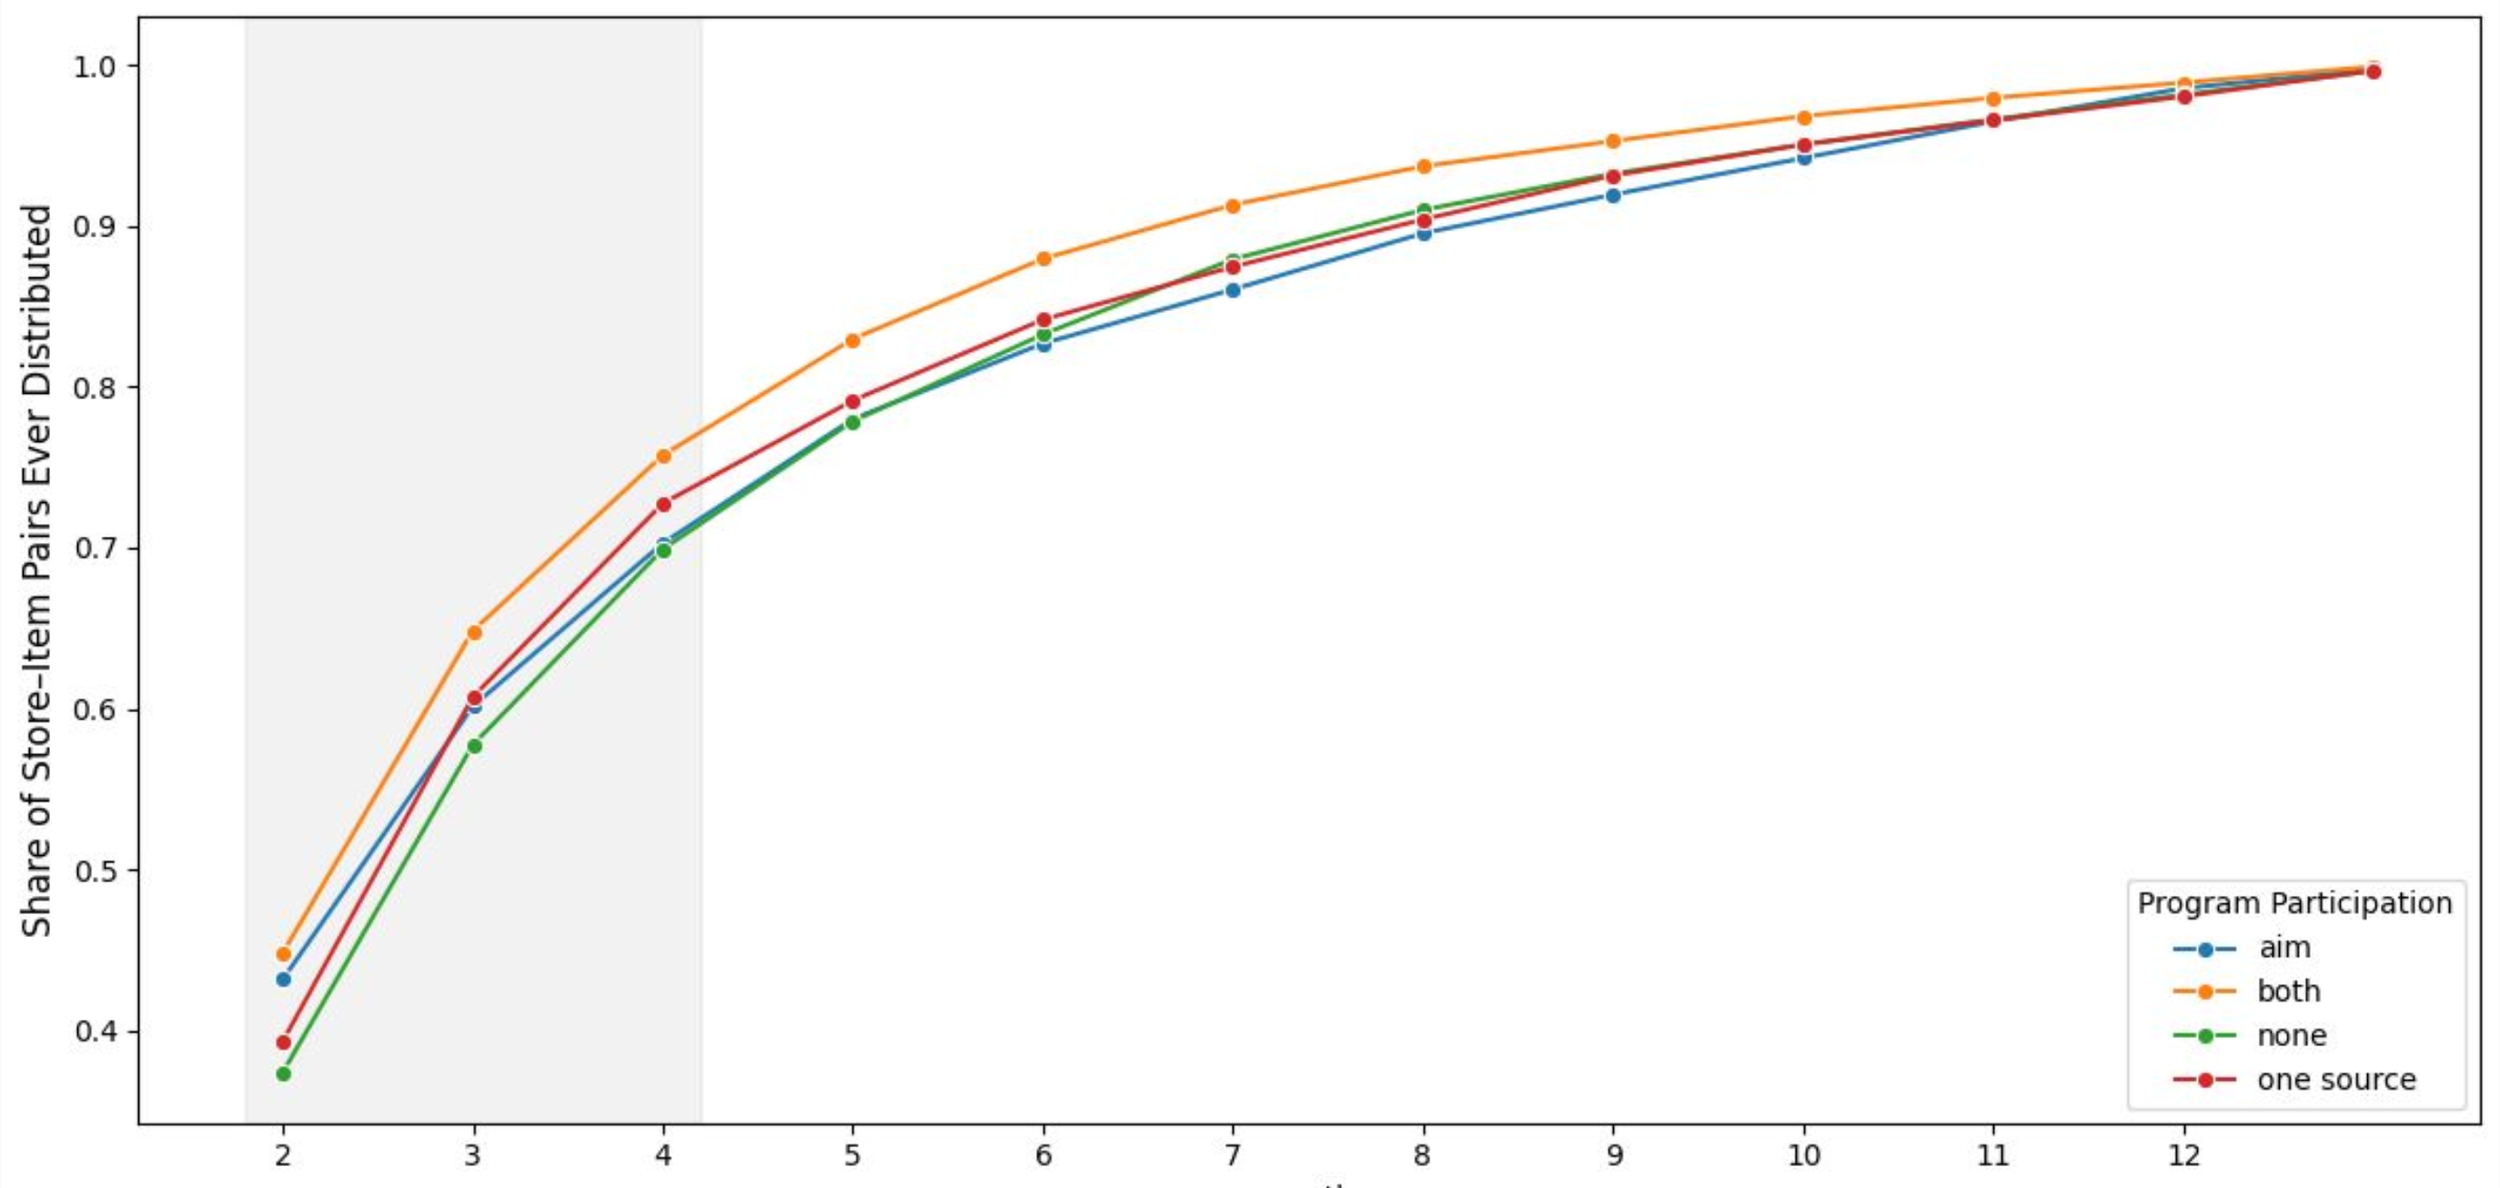
Cumulative Rollout Speed by Program
This S-curve illustrates the share of stores carrying each item over time, reinforcing differences in rollout speed across programs. The “Both” program achieves the fastest early adoption, while other programs lag behind during the initial months. By M12, all curves converge, confirming that program participation accelerates early distribution but does not affect ultimate reach.
This coefficient chart translates regression results into business terms by showing estimated sales lift with confidence intervals. The “Both” program delivers the highest lift at approximately ~20%, outperforming both One Source and AIM individually. This serves as the clearest evidence supporting the combined program as the most effective strategy for early sales performance.
Cumulative Rollout Speed by Program
This coefficient chart translates regression results into business terms by showing estimated sales lift with confidence intervals. The “Both” program delivers the highest lift at approximately ~20%, outperforming both One Source and AIM individually. This serves as the clearest evidence supporting the combined program as the most effective strategy for early sales performance.